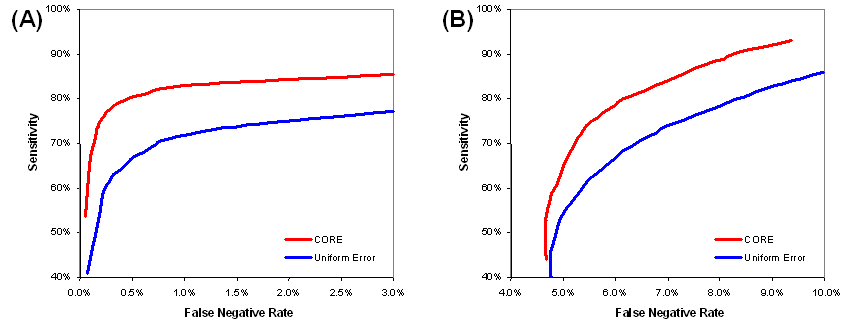
The ROC (receiver operating characteristic) curves show the tradeoffs between sensitivity and specificity (i.e., 1.0 - false negative rate) as the number of clusters is varied with two synthetic data sets. At each point along the curve, the sensitivity and specificity values are calculated as an average over 100 trials of generating synthetic data with a given number of classes and clustering the data with the same number of clusters as classes. (A) For the normally distributed synthetic expression data, the number of clusters is varied between 20 and 200. (B) For the periodic time series synthetic expression data, the number of clusters is varied between 2 and 20. The top curve (CORE) uses estimated standard error information from repeat measurements whereas the bottom curve uses a uniform error model, as described in the text.