Why choosing Chrome?
Developer Tools
All browsers have tools to help developers understand how their HTML, CSS, and Javasript code is being interpreted by the browser. In these notes you will become familiar with Chrome's developer tools, most importantly the Inspect Element window. In the future, we will also talk about how to use the Console to debug Javascript applications.
You can access the Elements window in several ways, choose one that you are comfortable with:
- Using the mouse (or trackpad): right-click and choose Inspect Element on the drop-down menu.
- Using the menu of Chrome: View | Developer | Developer Tools
- Using the keyboard: In Mac: Cmd + Opt + I; In Windows: Ctrl + Shift + I
 to
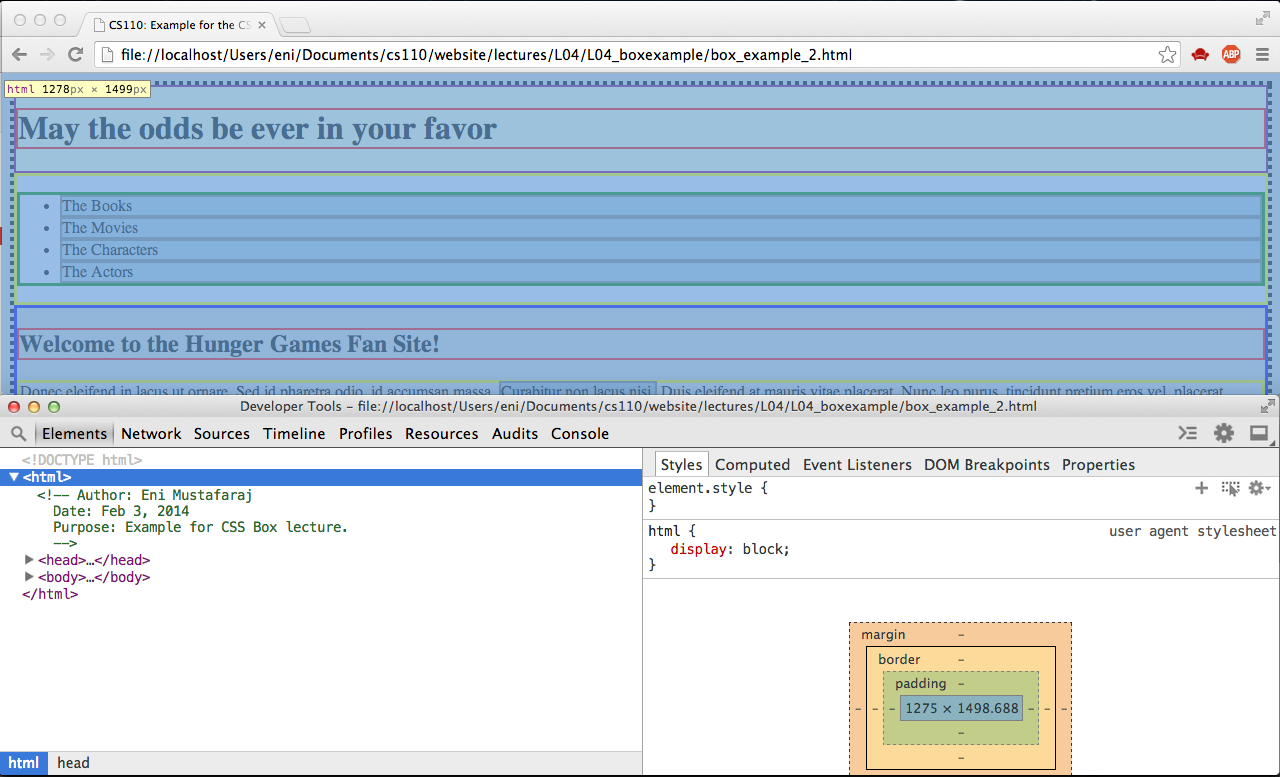
dock/undock it from the main window. Figure 1 shows the complete screenshot of a web page and
the dev tools at the bottom.
to
dock/undock it from the main window. Figure 1 shows the complete screenshot of a web page and
the dev tools at the bottom.
The Elements window and the Web page
The first thing to notice in the Elements window is that it is divided in two panes, on the left side we see a tree-representation of the nested structure of the HTML document (similar to that of folder and files in programs such as Finder (Mac) or Windows Explorer). On the right side there is a series of tabs, opened on Styles, showing what styles are applied to the selected element and how the browser has calculated the box that contains the element.
By selecting an element in the tree representation and hovering the mouse over it,
one can see how the corresponding area in the Web page is highlighted in blue,
also showing a little yellow box with the width x height dimensions of the element's content box.
In Figure 1, we notice in the upper part that the whole document is highlighted, because
we have selected the <html> element (in the Elements window).
Spend a few minutes navigating the document tree and highlighting different tags, to see the corresponding box on the Web page.
Your Exploration Task
Download the HTML file wellesley.html that you used in
Lab 2
and open it with your browser. This should be the file that doesn't link
to the stylesheet you generated in Lab.
Open the Inspect Element window and start exploring
the document tree. Notice how elements are nested in each other, e.g., <ul>
is nested in <nav>, <li>'s are nested
in <ul>, <a> is nested in
<li>, etc.
Click on one of the elements, for example the <a> tag
for Hillary Clinton and then inspect what you see in the Styles pane. Because
you haven't specified your own style for the page, the listed styles are the ones
provided by the browser (the user agent). Figure 2 shows the default style for
<a>. For the moment, don't worry about the complicated name of the selector
(a:-webkit-any-link), simply think that it is the style for a. Also,
notice how below the rule for a, the rules inhereted from its ancestors: li and
ul are shown.
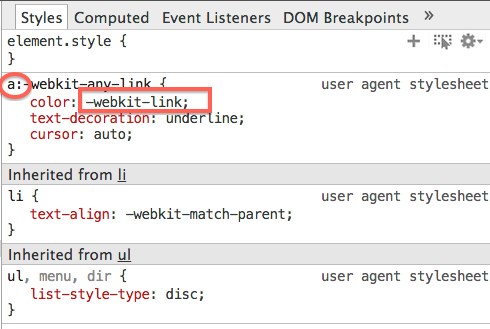
a.However, you might be confused by styles such as color: -webkit-link,
because the value it's not a kind of color. The reason for this is that the browser
keeps a table where every value such as -webkit-link is mapped
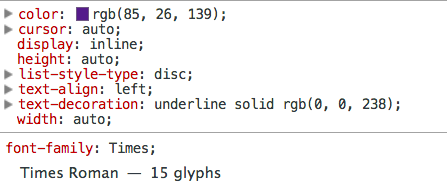
to a real value. You can see the results of this mapping in the Computed
tab,
as shown in Figure 3.
a.
Notice how now the color property has a real value now (don't worry if you
don't understand the rgb(85,26,139) value for the moment, it's a way to
represent colors with numbers, which we will discuss very soon).
Things to try on your own
For the wellesley.html document (without CSS styling), explore the
default styles for each element and look at what properties and values these styles have.
Here are some questions to ask yourself and figure out during the exploration:
- Which elements have the property
displayand what kind of values does this property take? - What can you say about the elements that don't have a
displayproperty? (For such cases, look at the "Computed" tab as well. - Select the element
h1in the document tree, then hover with the mouse over the colored box (it has the words: margin, border, padding). What do you see in the web page as you perform this hovering? Repeat the same for the elementul. - Do you understand what the numbers in the box mean?
- Resize your browser page, then click on the button reload
 . Which numbers in the box changed?
- Can you figure out the relation between the unit
emandpx, both used in the styles? Refer to the "Computed" tab for some help. - Select the element
navand then the elementfooter. What can you say about the selector or the rule?
Now that you have explored the default styles provided by the browser, you can move on to explore
what happens when you add your own stylesheet. For this, download your own lab2 folder
that you worked on the Lab. You should have a version of wellesley.html that is linked to a
style.css file on which you worked on the lab.
lab2
folder in the cs110dl account has a second subfolder, titled wellesleystyled.
There you find the solution for the lab2 exercises.
h1 element.
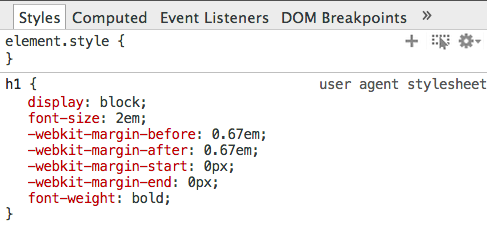
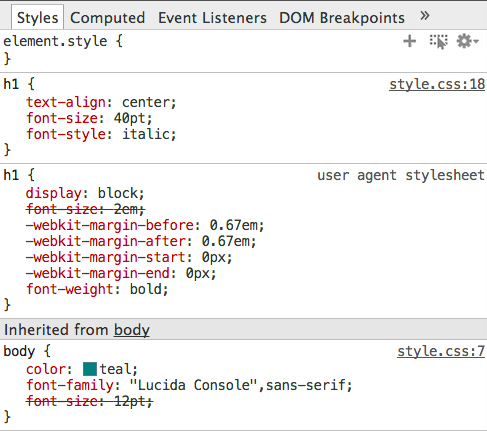
h1 (left) and user-defined styles (right).More Questions
To answer the following questions, you might need to compare several elements from the unstyled and styled document.
- Has the box size for
h1changed? Explain how this is possible. - Can you come up with the formula that calculates the entire box size that each element occupies in the page?
- Which are all the different ways that you can influence this box size through the stylesheet?