CS112: Lab 2 :: More MATLAB ::: more plotting

Let's work with some Facebook statistics* from May 2006 to May 2007 to create some more involved plots. Back in 2007, Facebook had 50 million users. In 2011, Facebook reached 750 million users; in 2018, 2.32 billion users.
Connect to the cs112 download folder using Cyberduck and grab a copy of facebook.m as a starting place to create these
plots. This MATLAB script merely contains the data shown below and
the corresponding date information. As you create your versions of
the plots below, make use of MATLAB's help to guide you.
| Date | 05/06 | 06/06 | 07/06 | 08/06 | 09/06 | 10/06 | 11/06 | 12/06 | 01/07 | 02/07 | 03/07 | 04/07 | 05/07 |
|---|---|---|---|---|---|---|---|---|---|---|---|---|---|
| unique visitors | 14069 | 13752 | 14365 | 14782 | 13341 | 15108 | 16695 | 19105 | 18961 | 16737 | 20896 | 23042 | 26649 | pages viewed | 6530 | 6093 | 6108 | 6463 | 7161 | 9437 | 9039 | 9064 | 10360 | 10779 | 12179 | 14997 | 15841 | minutes per visitor | 138 | 127 | 130 | 134 | 175 | 187 | 172 | 150 | 170 | 200 | 180 | 196 | 186 |
|
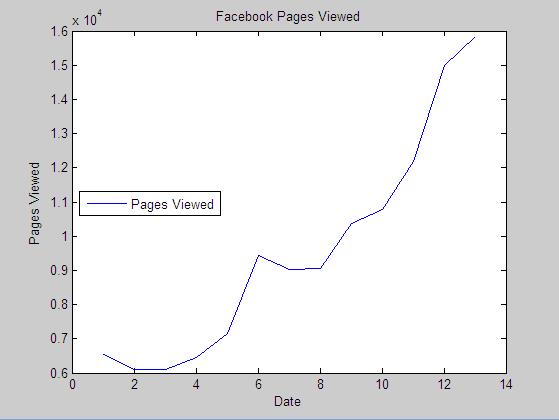
Exercise 1: Create this plot Plotting Pages Viewed against Date This is basically the default MATLAB single line plot. Your plot should have:
|
 |
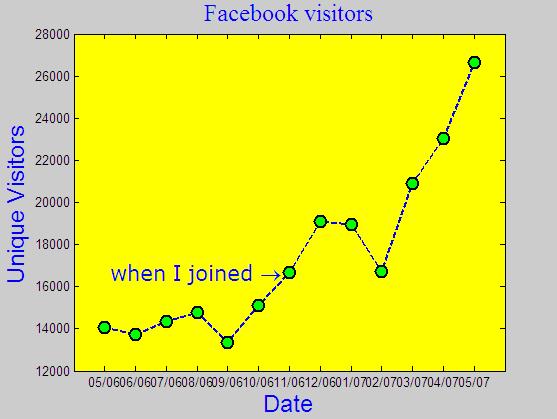
| Exercise 2: Create this plot Plotting Unique Visitors against Date This is a more colorful, easy-to-read line plot with a labeled point. You can choose your own colors/linestyles/line markers/point to mark/fonts/etc. Your plot should have:
|
 |
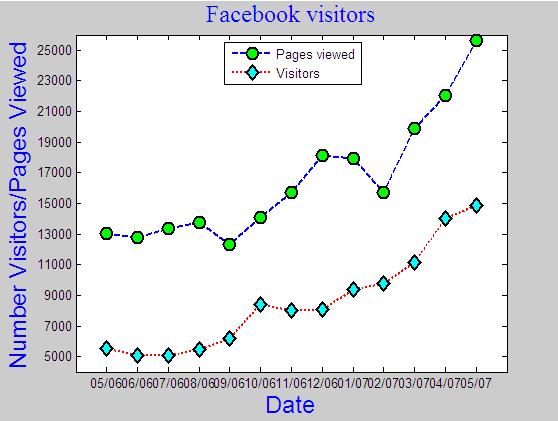
| Exercise 3: Create this plot Multiple Lines in One Plot As above, you have complete artistic freedom in choosing your colors/fonts/styles. Your plot should have:
|
 |