Specifying Colors in MATLAB
Colors can be specified in three different ways in MATLAB:
- short name (e.g. 'r' )
- long name (e.g. 'red')
- RGB triple (e.g. [1 0 0])
Here are the eight predefined colors in MATLAB with their names and
RGB equivalents:
| RGB value | MATLAB value | Short name | Long name |
|---|
| [255 255 0] | [1 1 0] | y | yellow |
| [255 0 255] | [1 0 1] | m | magenta |
| [0 255 255] | [0 1 1] | c | cyan |
| [255 0 0] | [1 0 0] | r | red |
| [0 255 0] | [0 1 0] | g | green |
| [0 0 255] | [0 0 1] | b | blue |
| [255 255 255] | [1 1 1] | w | white |
| [0 0 0] | [0 0 0] | k | black |
How to make up your own colors
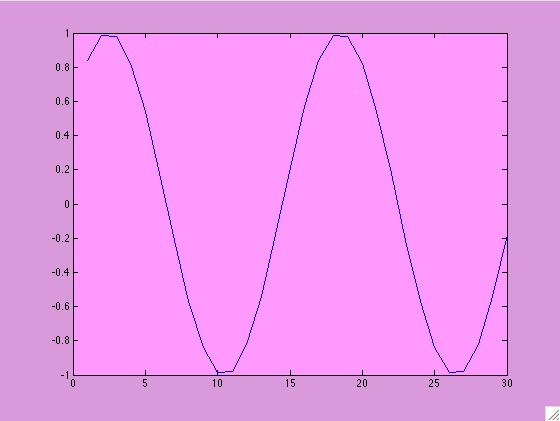
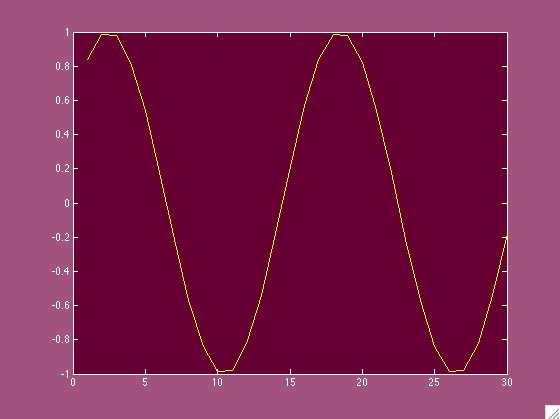
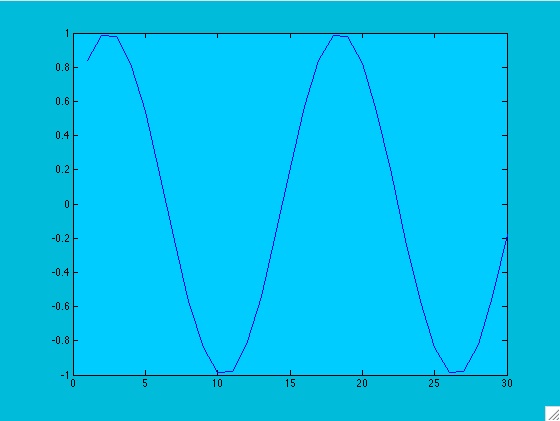
A subtle pink? A deep burgundy? A neon chartreuse? You can specify the RGB values and create any color you like. Below is a table of some sample colors:
| whitebg([255/255 153/255 255/255]) |
whitebg([102/255 0/255 51/255]) |
 |
 |
| whitebg([0/255 204/255 55/255]) |
whitebg([153/255 255/255 0/255]) |
 |
 |
These color combinations are available
here (and many other places, just Google "RGB chart").
Note:
- RGB color has a range [0 255] for each of the 3 colors (red/green/blue)
- each color is divided by 255 to keep it within the [0 1] range that MATLAB requires
- in the plots above, the color is the background color of the axes -- MATLAB automatically adjusts the other colors in the plot for suitable contrast
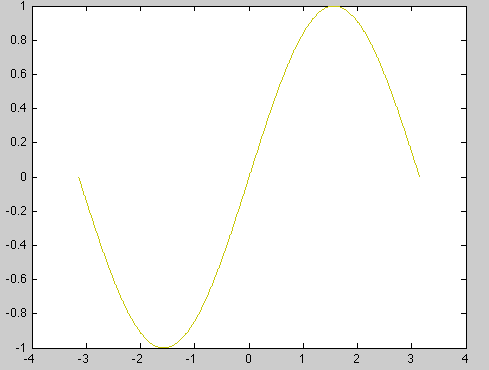
- How to just change the color of the line?
x = -pi:0.01:pi;

            plot(x,sin(x),'Color',[200/255 200/255 10/255]);
produces this olive greenish line:

Where to use color in MATLAB?
- line/marker/font colors
- background color of plot
- background color of axis (whitebg changes
background color for all axes in the figure, and any new following figures.)
Back to Lab 3 page


