| variables & MATLAB | vectors & conditionals | matrices & images | plotting | grab bag |
|---|---|---|---|---|
| fish = 1 | turkeys= [ 6 10 12 0 18] | 1) [3 1; 5 6] 2) ans = 3 2 1 5 |
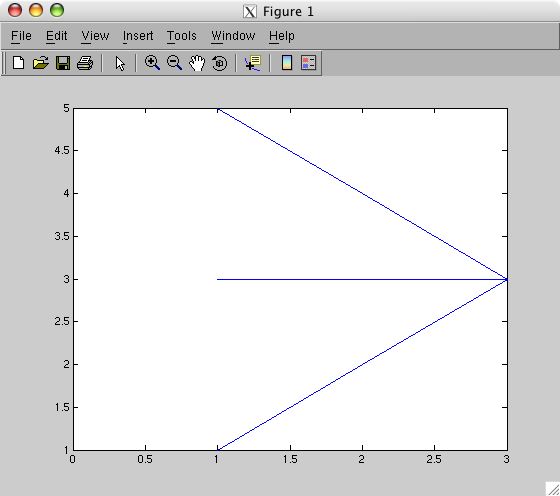
The x and y scales are in the same units (not necessarily the same range) in a given plot | lucky has no value, an error message is generated since the code tried to access a negative position in a vector |
| 51 | any(shoesizes == mean(shoesizes)) | matA = [ 5 5 5 10; 0 2 -35 2; -25 5 8 10] |
Click here for plot | error because lemons and limes are not the same size |
| 0 | yankees cubs |
days(sum(data) == max(sum(data))) | error: plot1 not recognized (legend needs plot handles) | grades(grades==max(grades)) = 0; max(grades); OR max(grades(~(grades == max(grades)))) |
| disp(['Nice to meet you, ' name ', have a nice day!']) | bubba = [2 6 10 12 6 10] |
sideways = W(:, 135:-1:1,:); imshow(sideways) |
Grenade: Bruno Mars Firework: Katy Perry Born This Way: Lady Gaga |
% first image grid = ones(500,225); grid(1:225,1:225) = apple; grid(276:500,1:225) = apple(:,225:-1:1); % black bar in the middle grid(246:255,:) = 0; figure,imshow(grid) % second, extra image grid2 = ones(225, 450); grid2(1:225,1:225) = 1-apple; % reverses color grid2(1:225, 226:450) = apple(225:-1:1,:); figure, imshow(grid2) |