Several color models are common in CG. We'll go over all of these in this reading. We'll also look at how colors are interpolated over closed regions (triangles and quadrilaterals).
hueis like the color wheel that we're familiar with from elementary school art. The color wheel is a 2D cross-section of a cone.
Our retinas happen to have rod-shaped cells that are sensitive to all light, and cone-shaped cells that come in three kinds: red-sensitive, green-sensitive, and blue-sensitive. Therefore, there are three (additive) primary colors: Red, Green and Blue or RGB. All visible colors are seen by exciting these three types of cells in various degrees. (Take a look at the Wikipedia page on Trichromacy for a good introduction.) The consequence is that almost any color can be mimicked by some amount of Red, some amount of Green, and some amount of Blue.
Color monitors and TV sets use RGB to display all their colors, including yellow, chartreuse, you name it. If we imagine that the amount of a primary color (Red, Green or Blue) is measured by a number from 0 to 255 inclusive, we can represent a color by a triple of numbers, such as (255,0,0), which is pure Red, and so forth. Here are some more interesting examples:
You can find more examples of these in any of zillions of color reference pages on the web.
The RGB color system is 3-dimensional. That is, you can think of it as a cube with three perpendicular axes: Red, Green and Blue. Because of the way our eyes work, that is sufficient to capture nearly every color.
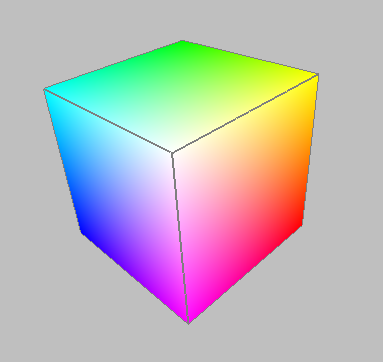
Here's an example of a color cube, built in Three.js:
A screenshot from an earlier version:
In the picture above, the red vertex is color (1,0,0): 1 on the red axis and zeros elsewhere. The green vertex is color (0,1,0) and the blue vertex is color (0,0,1). These are the primary colors. (Often, we normalize the RGB coordinates to [0-1]. You can think of it as a fraction of the maximum intensity. In the color cubes above, I have made the red axis the same as the x axis, the green with y, and the blue with z.)
The magenta vertex at the bottom is color (1,0,1). The cyan vertex is (0,1,1). The yellow vertex is (1,1,0). These are the secondary colors.
The white vertex in the center is color (1,1,1). The black vertex that we can see if we drag the WebGL color cube around is color (0,0,0).
Others of the millions of colors correspond to points in the interior of the cube. For example, Cornflower might be represented as:
R = 100/255 = 0.39
G = 149/255 = 0.58
B = 237/255 = 0.93
Of course, as you may know, integer division in C and in Python yields an integer result, so all the fractions in the example above evaluate to zero — hardly useful. Instead, we need to explicitly use floating point values. One way is to enter the values with decimal points.
R = 100.0/255.0 = 0.39
G = 149.0/255.0 = 0.58
B = 237.0/255.0 = 0.93
(Fortunately, integer division is not an issue with JavaScript, so you don't have to worry about it, but this trick of using decimal points is good to remember.)
Thought questions:
For more info, consult the Wikipedia article on RGB
Three.js has a Color class that allows you to enter colors in a variety of ways:
var red1 = new THREE.Color( 0xff0000 );  // hexadecimal triple
var red3 = new THREE.Color( 1, 0, 0 );  // color cube
var red2 = new THREE.Color( "rgb(255,0,0)" );  // CSS string
var red4 = new THREE.Color( "red" ); // CSS string
alert(red1.equals(red2) && red2.equals(red3) && red3.equals(red4));
alert("Numeric value: "+red.getHex())
alert("Hex String: "+red.getHexString());
We can use that idea in this demo to make a red barn:
Here's the relevant part of the code:
As you can see, the geometry of the barn is the same, but
the material is different. In this case, it's
a THREE.MeshBasicMaterial that is set to a particular
color. For some reason, THREE.js requires a numeric value, rather than
accepting one of its own Color objects, but the Color objects have a
method, getHex() which produces a numeric value that we can
use. (The method name implies that the value is hex, but it's just a
number, so you can print it in decimal or hex or whatever).
You'll notice that the red barn above lacks a lot of depth
cues
because there's no shading. Later, we'll learn about materials
that interact with light to produce nice shading.
In principle, each face (triangle) of a Three.js geometry object can be a different color. Setting it up is a bit more complicated than what we have so far, because we need to specify a color for each face. There are essentially two parts to the change:
THREE.MeshFaceMaterial .
Here it is in action: multi-colored barn:
Let's look at the code. First, the changed geometry:
You may have to look back at the definition
of TW.createBarn (all TW code is
in /~cs307/threejs/libs/tw.js)
to see how the faces were set up, or you could trust me that I got the
indexes correct.
The code uses a TW function to set the material index of several faces
at once. For example, if faces 0-5 are all material m, our
code would be tedious repetition of assignment statements like this:
  barnGeometry.faces[0].materialIndex = m;
  barnGeometry.faces[1].materialIndex = m;
  barnGeometry.faces[2].materialIndex = m;
  barnGeometry.faces[3].materialIndex = m;
  barnGeometry.faces[4].materialIndex = m;
  barnGeometry.faces[5].materialIndex = m;
Instead, we can say this:
TW.setMaterialForFaces(barnGeometry, m, 0, 1, 2, 3, 4, 5);
Finally, given such a geometry, we can create a list of materials to apply:
Note the array that spans lines 11 - 15; square brackets could easily
be overlooked, but the argument to THREE.MeshFaceMaterial
is an array of materials.
As you can see, we easily apply different colors to this barn, say to make it all red and green at Christmas, or orange and black on Halloween. However, if we wanted to make the front a different color from the back, we'd have to dig into the geometry object, make the material index for the back three faces different from the material index for the front three faces, and then use a five-element list of colors.
One thing to consider is coding technique and how to name your
variables. It seems intuitive to use a variable
like cornflower above to hold an instance
of THREE.Color() with the values for cornflower, and then
whatever you want to use that variable whenever you want something that
color, such as the sky or a barn. But suppose that later, you want to
make the sky a bit darker or the barn green. You could find all the
places in your program where you use the cornflower variable
and replace it with a variable name for a different color, or you
could adjust the values in the variable. But then cornflower
doesn't mean cornflower any more, which is very weird.
An alternative is to name the variable by what its purpose or use is. Such as:
var skyColor = new THREE.Color( 0.39, 0.58, 0.93 ); // use cornflower for the sky
Later, if you decide to change the color of the sky, you can change the
definition of skyColor and everything adjusts correctly.
This is a powerful idea.
You can even combine these approaches, by defining some of the colors you will use and then assigning them to various uses:
var cornflower = new THREE.Color( 0.39, 0.58, 0.93 );
var skyColor = cornflower;  // use cornflower for the sky
...
There is special hardware on a graphics card for computing the color of
a fragment
(such as a triangle). This hardware is called
the shader, and modern OpenGL programming allows you to write
code for the shader. Fortunately, the THREE.js software writes these
shaders for us.
When shading a fragment where the vertices are different colors, the shader has two choices:
To learn how OpenGL does this linear interpolation, we first have to understand how OpenGL represents lines. It uses parametric equations. Suppose we want to define a line from point A to point B. (Points A and B could be in 2D or 3D; everything works the same). All the following are equivalent:
P(t) = A + vt
P(t) = A + (B-A)t
P(t) = A(1-t) + B*t
All of these equations generate a point on the line given the value of the t. The parameter t can be any real number. Any value of t generates a point on the line. Thus, the 3D line is like the number line, with t=0 at A and t=1 at B.
The first equation form, above, defines the line using point A and a vector, v. Thinking visually, A is a dot and v is an arrow: point A is the starting point and vector v is the direction. For example, A might be "the center of Boston Common," and v might be "north" or "south by south west." If you start at A and go in direction v, your path will be a line. If we imagine that you start at A at time 0 and you move with constant velocity, any point on the line is defined just by the time. For example, P(4.5) would be your location 4.5 hours after you started.
The second equation uses two points, A and B, and substitutes B-A for the vector v. This is because one way to define a vector is to subtract two points. For example, if point B is "Logan Airport," we can define a line from point A to point B and we only implicitly know the compass heading, but we know that we're heading directly to the airport (as the crow flies). Interestingly, because of the way the vector is defined, we know we'll reach the airport exactly when t=1. As with the first form of the equation, any value for t generates exactly one point on the line.
The third form of the equation is just a bit of algebraic rearrangement of the second form. It emphasizes the idea that any point on the line segment from A to B can be defined as a mixture of A and B in some proportion. The midpoint is a 50/50 mixture (a parameter value of 0.5), but a 25/75 mixture is a point three fourths of the way towards B. (The greater the proportion of B, the closer we are to B.)
We can define lines that go through the same points but that have different equations. For example, a line from B to A. In that case, the equation looks like:
Q(s) = B + (A-B)s
With this line, s=0 is at B and s=1 is at A, so the line starts at B and goes through A. It generates the same points as P(t), but the interpretation of the parameter is different. In this case, the parameter goes in the opposite direction. (Someone driving on 95 from Boston to New York City drives the same road as someone driving on 95 from New York City to Boston, so it's the same line, but a different journey.)
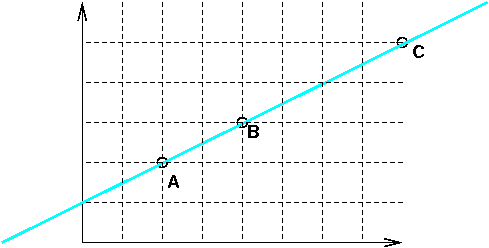
The math above works fine, but might be a little dry. Let's explore some metaphors for parametric equations. To start with, consider the picture in figure 1. The coordinates of the points are:
Suppose we have an ant crawling along the line. The ant starts at point A at time 0 and proceeds in a determined, steady, ant-like way to the upper right, arriving at B at time 1. Let's measure time in minutes and position in meters. We can say that
Suppose we have a different bug, maybe a beetle, that starts at B at time zero and gets to C at time 1. We can make corresponding observations:
But wait, you say. These stories of ants and beetles are all very good, but it's the same darn line. Are there two different equations for this one line?
Yes. One feature of parametric equations is that there are infinitely many equations for a particular line. We can choose one that is convenient for the problem we want to solve and the points we are given. Also, we can ask questions like:
Suppose a centipede starts at C at time 0 and gets to A at time 1. At what time does it meet (and eat) the ant? Where does this gruesome event occur?
Before we answer that question, let's look at another situation, this with two lines:
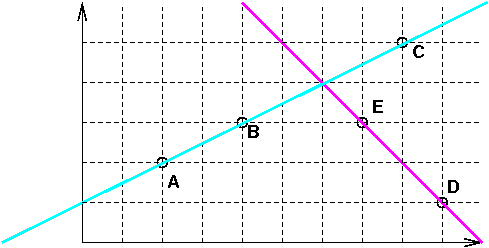
We now have two lines, the cyan one and the magenta one. We can see that they intersect, but where? Do the bugs meet? Convince yourself of the following:
P(t) = A + (B-A) t
P(t) = (2,2)+(2,1)t
Q(s) = D + (E-D) s
Q(s) = (9,1)+(-2,2)s
P(2) = A + (B-A) 2
P(2) = (2,2)+(2,1)2
P(2) = (6,4)
Q(1.5) = D + (E-D) (1.5)
Q(1.5) = (9,1)+(-2,2)(1.5)
Q(1.5) = (6,4)
In a way, I find the parameter somewhat reassuring, because a line is, intuitively, a one-dimensional thing, so a single, one-dimensional number should be sufficient for specifying a location on the line. That's exactly what the parameter does: it specifies where on the line a point is.
Forget about bugs crawling through a 2D Cartesian grid, or even flying through a 3D Cartesian space. Let's think about parametric lines in a different say, namely as a weighted average or as a mixture.
To start, I'm going to repeat figure 1, now as figure 3:
Let's think about a line from A to C:
P(t) = A + (C-A)t
P(t) = A + Ct - At
P(t) = A(1-t) + Ct
Intuitively, the point B is 1/3rd of the way from A to C, so we can make the following observations:
P(2/3) = A(2/3) + C(1/3)
P(2/3) = (2,2)(2/3) + (8,5)(1/3)
P(2/3) = (4/3,4/3) + (8/3,5/3)
P(2/3) = (12/3,9/3)
P(2/3) = (4,3)
P(2/3) = A(2/3) + C(1/3)
Thus, points on the line segment from A to C can be viewed as weighted averages of the two endpoints. For example, if a course's grade depends only on a midterm and a final, and the final counts twice as much as the midterm, you'd compute the course grade as:
grade = midterm*(1/3) + final*(2/3)
That's exactly the kind of equation we have for this line!
We can also think of the points on the line segment as different mixtures of the endpoints. For example, when cooking rice, we need to get the right balance of rice and water. If the point A represents 100% water and the point C represents 100% rice, the parameter of any point on the line segments represents a ratio of rice to water.
The point B has a parameter of 1/3, so that means it's a mixture of 2/3 of A (the water) and 1/3 of C (the rice). Remember the parameter and the weights are inversely related: the parameter tells how far we are from the starting point, and the weight is proportional to how near we are to an endpoint.
Note that the mixture
metaphor doesn't work so well for points
on the line but outside the line segment (110% rice and -10% water?),
but it works very well for points on the interior of the line segment,
and computer graphics is usually more concerned with line segments than
infinite lines. So this is a useful metaphor.
In particular, if points A and C are different colors and the line segment is being drawn with interpolated color, the points on the line segment can be colored using the mixture idea. If A is red (1,0,0) and C is green (0,1,0), the point B will be:
B = A(2/3) + C(1/3)
B = (1,0,0)(2/3) + (0,1,0)(1/3)
B = (2/3,1/3,0)
Suppose we want a line from A through B, with:
A = (1,2,3)
B = (2,5,1)
We can write down the following equations:
The last equation gives another way to think about parametric equations: by introducing a parameter (in this case, "t"), we write an equation that generates each coordinate independently. The equations in this example are:P(t) = A+(B-A)t
P(t) = (1,2,3)+(1,3,-2)t
P(t) = (1+t, 2+3t, 3-2t)
x(t) = 1+t
y(t) = 2+3t
z(t) = 3-2t
This makes it easy to see how parametric equations work so well in 3D: each spatial coordinate (x, y, and z) is generated by a simple linear function of just a single parameter, namely t. None of this y=mx+b stuff that doesn't work in 3D.
Why are parametric equations so cool???
Problem: Find the coordinates of a point 2/3 of the way from A=(2,3,4) to B=(5,9,1)
Solution: Since the point is 2/3 of the way from A to B, our parameter is 2/3 and our starting point is A. Our vector v is (B-A).
v = B-A = (5-2, 9-3, 1-4) = (3,6,-3)
Now, we can substitute into our equation and solve
| P(2/3) | = A+v(2/3) |
| = (2,3,4) + (3,6,-3)(2/3) | |
| = (2,3,4) + (2,4,-2) | |
| = (4,7,2) |
So, the point 2/3 of the way from A to B has coordinates (4,7,2). Done!
Note that we could have solved this problem slightly differently, using the mixture equation. We compute a mixture of two parts B to one part A:
| P(2/3) | = A(1/3)+B(2/3) |
| = (2,3,4)(1/3) + (5,9,1)(2/3) | |
| = (2/3,1,4/3) + (10/3,6,2/3) | |
| = (4,7,2) |
This may seem weird at first, because we're using a weight of 1/3 on A and a weight of 2/3 on B, but the point is closer to B, so the weight on B has be greater.
Problem: Suppose that vertex A is red (1,0,0) and vertex B is magenta (1,1,0). What is the color of the point that is 2/3 of the way from A to B?
Solution: We can use the same mixture equation that we just used to find coordinates:
P(2/3) = A(1/3) + B(2/3)
P(2/3) = (1,0,0)(1/3) + (1,1,0)(2/3)
P(2/3) = (1,2/3,0)
Note if a problem calls for more than one line, each line gets its own parameter, such as r, s, or u. This makes sense because the parameters have meaning: t=0 means the initial point of the line, so s=0 would be the initial point of the other line.
Since a triangle is a 2D thing, the parametric equation for a triangle will have two parameters. One way to think about these two parameters is that the first parameter, say t, moves you along one side of the triangle, from vertex A to vertex B. Let P(t) be that point along the AB edge of the triangle. The second parameter, say s, is the parameter of a line from vertex C to P(t). That is, the endpoint of the second line is a moving target. The point Q(s,t) is a point in the triangle, on a line between C and P(t).
The following figure sketches these ideas:
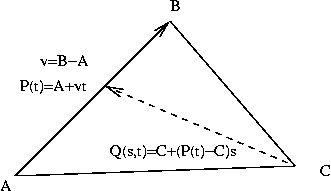
Q(s,t) = C + (P(t) -C)s
Q(s,t) = C + (P(t)s - Cs)
Q(s,t) = [A(1-t)+B(t)]s + C(1-s)
Q(s,t) = A(1-t)s+Bts + C(1-s)
Notice that we have several choices: the line from A to B could instead go from B to A. Similarly, the line from C to P(t) could go from P(t) to C. These yield equivalent equations, just as the equations of a line from A to B is equivalent to a the equation of a line from B to A.
The last line of the math for Q(s,t) above shows a three-way mixture of the vertices. That is, a triangle is all points in the convex sum of the vertices. A convex sum is a weighted sum of N things, where the weights all add up to 1.0:
w1*A+w2*B+w3*C
w1+w2+w3 = 1
Compare this to the weighted sum formula for Q(s,t). The last equation is perhaps a little surprising, but you can check that the weights sum to one:
(1-t)s+ts+(1-s)=1
Incidentally, the center of the triangle is when all the weights are equal: one-third.
Suppose we have a triangle ABC whose vertices are:
A = (1,2,3)
B = (2,4,1)
C = (3,1,5)
We could write down the following equation for the triangle:
Q(s,t) = A(1-t)s + B(t)s + C(1-s)
Q(s,t) = (1,2,3)(1-t)s + (2,4,1)ts + (3,1,5)(1-s)
So, doing each coordinate separately, we have:
x(s,t) = (1-t)s + 2ts + 3(1-s)
y(s,t) = 2(1-t)s + 4ts + (1-s)
z(s,t) = 3(1-t)s + ts + 5(1-s)
Which we can simplify algebraically to
x(s,t) = (1-t)s + 2ts + 3(1-s) = s-ts+2ts+3-3s = ts-2s+3
y(s,t) = 2(1-t)s + 4ts + (1-s) = 2s -2ts + 4ts + 1-s = 2ts + s + 1
z(s,t) = 3(1-t)s + ts + 5(1-s) = 3s -3ts + ts + 5 - 5s = -2ts -2s + 5
Suppose we have a point whose parameters with respect to that triangle are (0.5,0.5). What does that mean? It means that the point is halfway between C and the midpoint of AB. The coordinates are:
So the coordinates of Q(0.5,0.5) are (2.25,2,3.25).x(0.5,0.5) = (0.5)(0.5)-2(0.5)+3 = 2.25
y(0.5,0.5) = 2(1-0.5)0.5 + 4(0.5)(0.5) + (1-0.5) = 2
z(0.5,0.5) = 3(1-0.5)0.5 + (0.5)(0.5) + 5(1-0.5) = 3.25
Equivalently, we can think of computing Q(s,t) as a weighted sum of the triangles vertices:
Q(s,t) = A(1-t)s + B(t)s + C(1-s)
Q(0.5,0.5) = A(1-0.5)(0.5) + B(0.5)(0.5) + C(1-0.5)
Q(0.5,0.5) = A(0.25) + B(0.25) + C(0.5)
Then, to find the coordinates of Q(0.5,0.5), we just substitute the coordinates of ABC and calculate the weighted sum.
If the colors of the vertices are different, OpenGL interpolates them, using the same equations that we used for calculating coordinates. Suppose A is red (1,0,0), B is magenta (1,0,1) and C is yellow (1,1,0). We can compute the color of the middle point, Q(0.5,0.5), as:
Q(0.5,0.5) = A(0.25) + B(0.25) + C(0.5)
Q(0.5,0.5) = (1,0,0)(0.25) + (1,0,1)(0.25) + (1,1,0)(0.5)
Q(0.5,0.5) = (1,0.5,0.75)
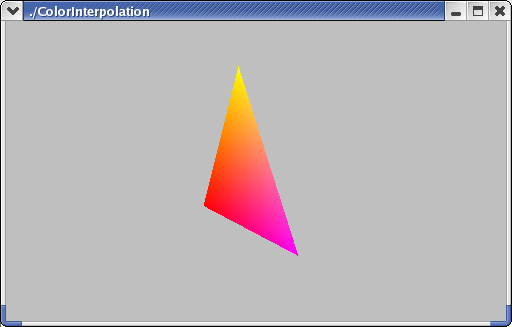
The triangle as a whole looks like this.
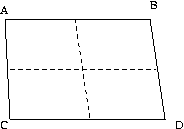
A quad works the same way, except that now the parameter t moves along both sides of the quadrilateral. In the figure below, t might move us from A to B and simultaneously from C to D. Meanwhile, s moves us from P(t) along the upper edge down to Q(t) along the lower edge.
Thus,
R(s,t) = sP(t) + (1-s)Q(t)
In a hardware implementation, the graphics card figures out the intersection of the projection of two segments with a scan line (one of the lines of the raster, corresponding to a horizontal line of pixels on the monitor). That gives the colors of both endpoints. Then, it fills the pixels in between, stepping the color by the same amount at each step. If there are 100 pixels between the edges of the projection, the color is stepped in 99 equal-size increments.
Don't rely on OpenGL to do bi-linear interpolation on quads or the
right thing
for general polygons. It's much better to break it down
into triangles and use that. This is because graphics cards break larger
polygons into triangles for fast processing. THREE.js does this for us.
Suppose you have a quad with three red vertices and one white vertex. You might expect a smooth gradient of pinkness as you approach the white vertex. In fact, it depends entirely on which vertex is the white one. If it's the fourth vertex, the triangulation will leave that vertex entirely out of the first triangle, and so the first triangle will be solid red. The second triangle will have the shading you expect, though starting closer than you'd expect. However, if the white vertex is the first vertex, both triangles will have a white vertex, and so you'll get much more of the shading you'd expect, though, in fact, neither will match the result you'd get with bi-linear interpolation.
The following figure demonstrates several different results of drawing a quad with smooth shading and each vertex having a different color. In every case, vertices are given to OpenGL in clockwise order; in this case, starting at the lower left (the red vertex). It goes Red, Green, Blue, Yellow.
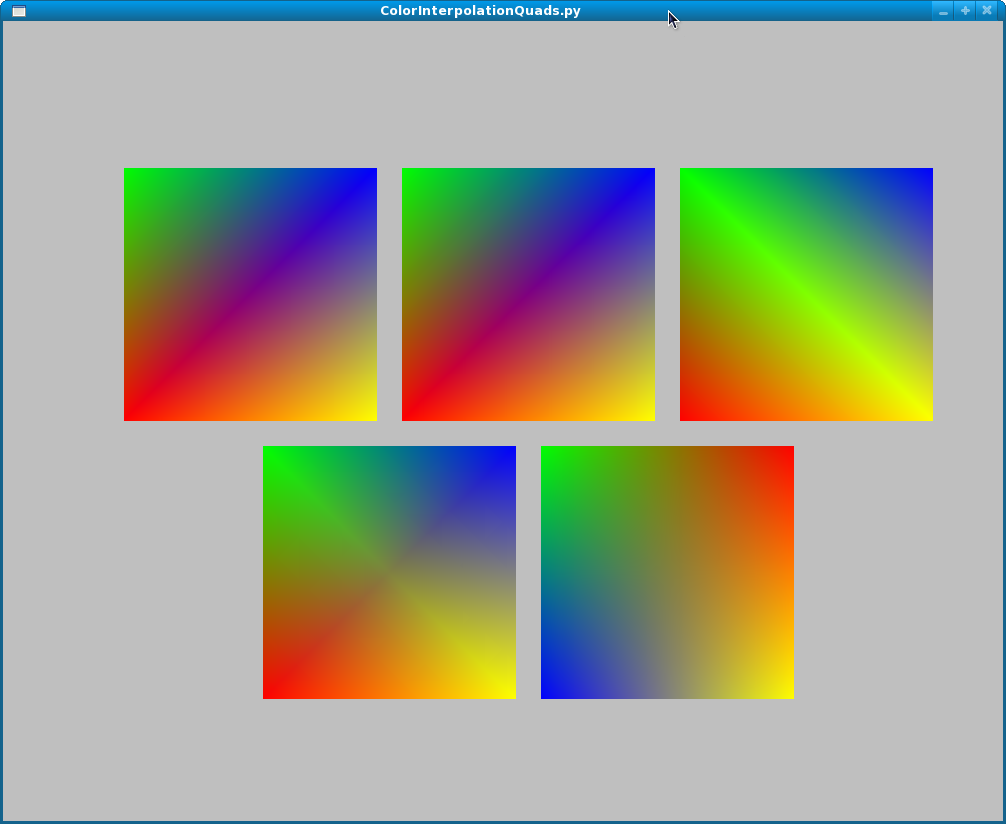
The pictures in the first row are (1) a quad with RGBY vertices with the first vertex being the lower left one and proceding clockwise, (2) two triangles cut along the diagonal from lower-left to upper-right, (3) two triangles cut along the diagonal from upper-left to lower-right. Note that the quad matches the second figure, not the third. This shows that the triangulation is done as you'd expect: the first three vertices are formed into a triangle, then the next three.
The pictures in the second row are (4) the quad cut into four triangles using the middle point, and (5) the quad cut into 400 quads using a mesh.
The main problem is that the two triangulations are different, when you might think it wouldn't matter. (With flat shading, they don't, because the fourth vertex determines the color.) Next, none of the elements on the first row matches the four-part triangulation in the second row. The fifth version is the smoothest yet, but you might think they should all match.
Additive color mixes light: the more, the brighter. As most people remember from kindergarten, mixing fingerpaints makes things darker. That's because paint (and ink, and so forth) works by subtracting light.
Subtractive color is used in the printing industry. The primaries are:
C = 1 - R
M = 1 - G
Y = 1 - B
The 1 in the preceding equations is a vector of all 1s, so cyan = (1,1,1) - (1,0,0) = (0,1,1), which is a mixture of Green and Blue (the other two primaries). These are the additive secondaries
Theoretically, you can mix all three subtractive primaries to get black, but if you do you usually get a dark, muddy brown, so we introduce a fourth primary: black, abbreviated K.
These are collectively called CMYK. Think of the four cartridges on a color ink-jet printer.
Psychologically, humans don't think in terms of light and RGB. For example, it's very weird to think of yellow as red+green. Most people find it more intuitive to think of
Roy G. Biv?
These three dimensions can be defined in terms of RGB, and we can convert back and forth with some complicated math.
How do the HSL dimensions relate to the RGB dimensions? First, imagine a line starting at the black vertex of the color cube and going through the center of the cube and ending at the white vertex. That is, the line goes directly from (0,0,0) to (1,1,1) in RGB space.
Now, realize that the coordinates of every point on that line are all equal; that is, every point is (a,a,a) for some value of "a" between 0 and 1. Because the coordinates are all the same, that means every point on the line is gray. The line starts at black, goes through dark grays, becoming lighter, until it ends at white. This axis is lightness. The farther a point is from black, the greater its value. (This is an approximate definition; the math is a bit complicated, and I'm only trying to give some intuition.)
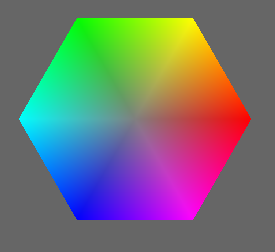
If we choose a particular number for the lightness, say 0.5, we get a two-dimensional surface going through the RGB cube. Let's press that surface out flat on a piece of paper, so we can think in two dimensions instead of three. One way to do so results in a hexagon, like this:
In the center of that region is the place where the gray axis (the axis from pure black to pure white) pierces the region. Let's call that the gray point.
Imagine asking how far a point in the region is from the gray point.
If the point is near the gray point, the point is similar to that value of
gray, and the color is called unsaturated.
If the point is far
from the line, the color is called saturated,
so distance from the
gray point is saturation. (Again, this is an intuitive definition,
not a mathematical one.) Looking at the figure above, you'll notice that
the colors are more intense (saturated) near the perimeter.
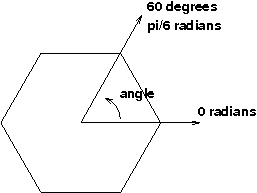
Finally, pick the reddest point on the edge of the region, and connect the gray point in the center with the red point on the edge. Now, any point in the region can be described not only by its distance from the gray point, but also by the angle with respect to this reference line. The hue is defined as this angle. The color with hue of zero (at 3 o'clock if you image the color wheel like a clock) is red. Any saturation of red will have an angle of zero, greens will be at about 120 degrees (11 o'clock), and blues will be about about 240 degrees (7 o'clock). Yellows will be between red and green, so angles of about 60 degrees (2 o'clock), and so forth.
Here's a decent interactive color wheel
The Wikipedia article on HSL and HSV is good. I particularly like this picture of the double hexcone model.
Color perception is a fascinating topic that we won't be able to explore entirely. However, just to whet your appetite, here's an amusing optical illusion with color perception: color perception
HSL and HSV both use the same intuition above. The difference is that the breadth of the pyramid is biggest at a value=1 for HSV, and for HSL, the breadth is maximized at lightness=0.5. For lightness from 0.5 to 1, we get a second pyramid, shrinking down to an apex of pure white. So, HSL is like HSV except that it's a double hexcone. This reflects the fact that as you get closer to white, there is less "room" for hue and saturation information. The double hexcone is a better approximate for the RGB color cube, but both are non-linear transformations. HSV is more commonly used in computer graphics, while HSL is more commonly used by artists. Nevertheless, THREE.js has support for converting from HSL to RGB and back, so we'll use that.
For more info, consult Wikipedia article on HSL
If you want to use HSL in your THREE.js programs, you certainly can.
The THREE.Color() object has method to convert from and
to HSL values.
For example, suppose you want to use a less-saturated red. Red happens to have a hue angle of zero, and we'll use 0.5 for the lightness (through the fat part of the double hexcone, see below), and then we'll turn down the saturation. Here's some code:
var red = new THREE.Color("red");
alert("red is "+red.getHexString());
var red_hsl = red.getHSL();
alert("red is hue of "+red_hsl.h+", lightness of "+red_hsl.l+" and saturation: "+red_hsl.s);
var less_red = new THREE.Color();
less_red.setHSL(red_hsl.h, red_hsl.l, 0.5 * red_hsl.s );
alert("less_red is "+less_red.getHexString());
The background color of this paragraph is the half-saturated red, or #bf3f3f, that we just computed using THREE.js's Color object
Note that hue is considered an angle, but the API in THREE.js has it go from zero to one, rather than using degrees (zero to 360) or radians (zero to 2*π).
When we press the region flat into a hexagon, that means that the full
3D space is a pair of hexcones,
as demonstrated by the following
THREE.js program. The first hexcone has a lightness value that goes from
0 (completely black) at the apex to 0.5. The second hexcode has a
lightness value that goes from 0.5 to 1 (completely white) at the apex.
Here's the color cones demo:
Be sure to look at it from the side (+X direction) by using the "x" key or dragging with the mouse.
The demo has some additional keyboard callbacks:
The code for the Color Cone Scene is here. Note how the keyboard callbacks are set up.
Finally, if you're curious, here is how the color pyramids are built:
Understanding polar coordinates like this is important, so take a few minutes to understand this code, particularly lines 27--35. This figure may help:
The Color Cone demo allowed you to adjust the number of vertices up and down. That code can be broken down into three simple parts:
TW.setKeyboardCallback()
after TW.cameraSetup(), which is when the built-in key
callbacks are set up.
This technique will let you dynamically adjust many aspect of your models very easily.
Color TV is broadcast in YIQ, which has intensity (luminance or brightness) as one signal (Y) and two others encode chromaticity (hue and saturation, but not respectively). So it's similar to HSL and HSV in that the black/white signal is one channel (Y), just like L and V.
The purpose of these thought problems is to start thinking about color interpolation. As it turns out, the cone cells are not equally sensitive to light. In particular, the blue cells are less sensitive than the red and green. Consequently, many colors have more blue in them than you'd think. For example, (1,0.75,0.8) turns out to be a decent pink.
© Scott D. Anderson
This work is licensed under a Creative Commons License
Date Modified:

