D3.js - An introduction
The first time (and fifth time, and possibly even the tenth time) you see or try and write D3 code your head will hurt. Like SQL, D3 is an incredibly powerful abstraction over visualising data that deals with almost all of the how for you, and lets you just say what you want to happen.
by Philip Roberts in Imperative vs. Declarative.
D3.js - A history
D3.js is a Javascript library, that grew out of a research-framework, named Protovis, developed at the Stanford University Visualization Group, directed by Jeff Heer. It was developed by Mike Bostock (at the time a PhD student at Stanford), Jeff Heer, and Vadim Ogievetsky and was officially launched in 2011.
D3 stands for Data-Driven Documents. Its authors describe it as: an embedded domain-specific language for transforming the document object model (DOM) based on data. Why DOM? The success of the Web is made possible by the seamless cooperation among several technologies: HTML - for the page structure and content, CSS - for layout and styling, Javascript - for interaction, SVG - for vector graphics, etc. This cooperation is enabled by the DOM, which exposes the hierarchical (tree-like and nested) structure of the page, allowing us to reference and manipulate elements. Additionally, all browsers provide developer tools such as Inspect Element and the Console, which allow us to inspect and interact with this representation. This is a powerful learning and debbugging mechanism, which closed systems that abstract away details from the users do not offer. By choosing to make D3 work with the DOM, the authors take advantage of this existing ecosystem of technologies to offer a powerful and accessible language.
D3.js Galleries
There are many galleries in the web containing interesting and powerful D3 visualization.
First stop should be the work that Mike Bostock has done for the New York Times.
Then, you can visit the gallery in the D3 main website.
Of interest to computer scientists is the personal library of Bostock's "blocks", which are small visualization about a topic (such as algorithms).
The blog TechSlide curates a list of 2000 D3.js examples and demos in alphabetical order. The blogwriter has a world map guessing game that some of your might find interesting, given that in AM3 several wrote games for Google Maps.
Finally, here is an animated Bezier curves explanation.
D3 as part of the Web ecosystem
D3 is not a traditional visualization framework. Instead it focuses in a specific, narrow problem: how to efficiently manipulate (web) documents based on data. Some of the features that contribute to its strengths are:
- It belongs to the list of tools known as document transformers, of which,
jQuery is another example. They all have in common the concept of selection,
which identifies a set of elements using a simple predicate and then applies a series
of operators to mutate the selected elements. We have seen this in Javascript, CSS, jQuery,
and now D3.
  // 1. Javascript code to change the color of all p elements to red
  var ps = document.getElementsByTagName("p");
  for (var i = 0; i < ps.length; i++) {
   var p = ps[i];
   p.style.setProperty("color", "white", null);
 }

 // 2. CSS Rule
 p { color: red;}

 // 3. jQuery code
 $("p").css("color", "red");

 // 4. D3 code
 d3.selectAll("p").style("color", "red");
D3 goes beyond what is possible with CSS or jQuery, because in addition to modifying existing elements, it creates and deletes elements to match a dataset. jQuery doesn't have an easy way to do this operation in one step. This makes jQuery ill-suited for dynamic visualizations with complex transitions. Instead, this is very simple and efficient in D3. - D3 relies on the standard format SVG for graphics and the DOM. Other visualization tools, such as Processing have their own graphics primitives. By relying on W3C open standards, D3 can benefit from the knowledge of such standards as well as the available reference documentation.
- D3 is a declarative, domain-specific language. Domain-specific means that is specialized for a particular application domain (in D3's case, the Web). Declarative means that it is not concerned with how things are accomplished, but with what should be accomplished. HTML and CSS are also declarative languages, we only describe what we want to see on the page, but not how that should happened, the browser takes care of it. D3 continues this tradition of its sister technologies.
D3 Features
Here is a high-level overview of the language that summarizes all its features, which can be found in the research paper written by Bostock, Ogievetsky, and Heer.
- D3's atomic operand is the selection: a filtered set of elements queried from the current document.
- Operators act on selections, modifying content.
- Data joins bind input data to elements, enabling functional operators that depend on data, and producing enter and exit subselections for the creation and destruction of elements in correspondence with data.
- While operators apply instantaneously by default, animated transitions interpolate attributes and styles smoothly over time.
- Special operators called event-handlers respond to user input and enable interaction.
- Numerous helper modules, such as layouts and scales, simplify common visualization tasks.
Selection
D3 adopts the W3C Selectors API to identify document elements for selection. Selectors allow us to retrieve certain desired elements from the DOM. You are familiar with selectors from their use in CSS and jQuery. They allow to retrieve elements by tag name, by class or id, by containment ("parent child"), by attribute name "[name=value]", and many more. For a complete list, refer to the W3Schools reference on selectors.
The global object d3 exports the two methods .select()
and .selectAll() which then are used to obtain the selections, given the selector
as an argument. The difference between these two methods is that the former selects only the first element that matches the selector, while the latter selects all matching elements in the document.
File ex1.html in the folder of examples (see below), has several code snippets
with the usage of different kinds of selectors.
Operators and Chaining
Once we have some selected elements, we can use a number operators on them, for example
.attr() - to set attributes, .style() - to apply CSS, .text()
- to change the text of the selection, .html() - to modify the HTML content of
the selection.
Each of these methods returns the selection, therefore, we can chain multiple operators together.
Another feature of these operators is that they can be used in different ways and with different parameters. Below are some simple examples:
// With one argument
d3.select("p").style("font-size"); // returns the value for the style 'font-size'

// With two arguments
d3.select("p").style("font-size", "40px"); // sets the value for the style 'font-size'

// With two arguments, the second one a function
d3.select("p").style("font-size", function(){ // use a function to generate a value
  return Math.floor(Math.random()*50) + "px";
  });
The use of operators with functions as arguments is very important, because this is how
we will be able to change the elements of the page, by binding them to
data. Examples of such code can be found in the file ex2.html of our
folder of examples.
Code for exercises
At this point, please download this zipped archive and open it on your computer. We will be interactively inspecting and executing code, in order to cement our understanding of D3 features.
Data Binding
The .data() operator binds input data to selected nodes in the DOM.
The input data is specified as an array of arbitrary values, such as numbers, strings or objects.
Once data is bound to elements, it is passed to functional operators as the first argument
(by convention, d), along with the numeric index i.
By default, data is joined to elements by index: the first element to the first datum, and so on.
Here is an example of some code where we bind data to nodes. This example can be found
in the file ex2.html.
var sizes = [15, 30, 45, 60, 75, 90]; // array of data
d3.selectAll("p")      // select DOM elements
  .data(sizes)         // bind data to selected elements
  .style("font-size", function(d){  // functional operator that applies to every element
    console.log("value is: ", d);   // printout in the console value of d (a datum)
    return d + "px";
});
The screenshot below shows the output in the console when the code is executed. We also show the selection, to point out that the value of datum that is bound to every element is attached as a property to the element and it has therefore become "sticky".
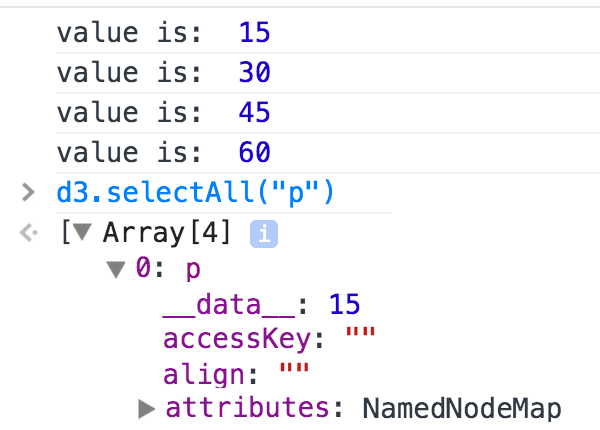
__data__ for the first p node.
It stores the value of the bound datum.Entering and Exiting
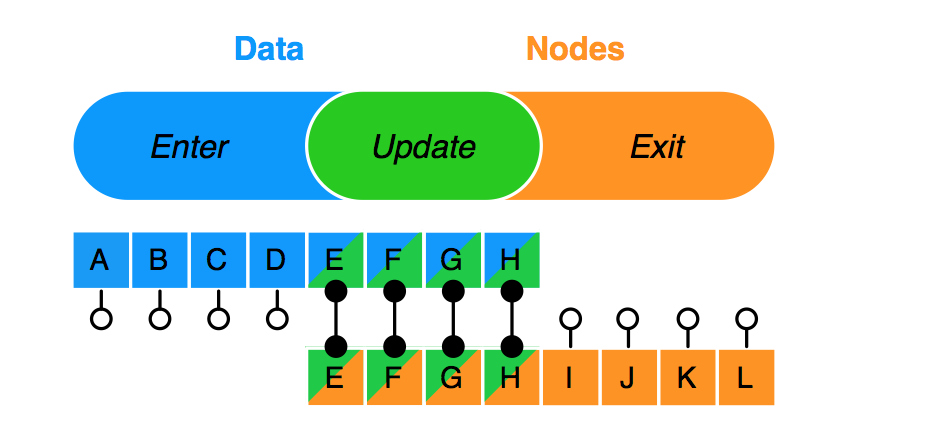
Often the number of data values and selected nodes (DOM elemenets) will be different. When there are
more data than nodes, the remaining data points are known as the enter subselection.
When there are more nodes than data, the remaining nodes are known as the exit subselection.
Two methods, .enter() and .exit() will give us access to such subselections
and then we can perform operations to them, such as appending to the DOM the entering data or
removing from the DOM the exiting nodes. The .data() operator itself returns
the so-called updating nodes, those nodes that were bound to the incoming data. Below is a
graphics to visualize the sets of enter, update, and exit. These concepts are at the heart of D3.
Understanding them helps you becoming more proficient in D3.
I have created a few examples to help you explore .enter() and .exit().
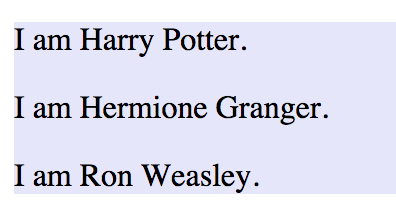
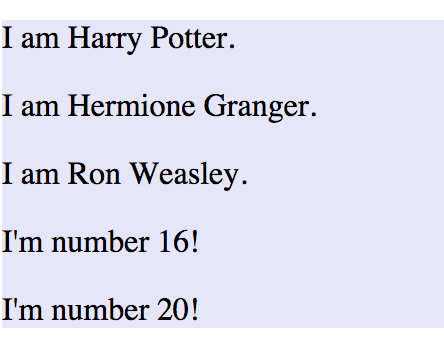
Here is the first example (see file ex3.html in the examples folder):
var someData = [4,8,12,16,20];

d3.select("#section1").selectAll("p") // select p inside #section1
    .data(someData)
  .enter().append("p")
    .text(function(d){return "I'm number " + d + "!";});
As you see in the screenshot on the left below, our selection has three
nodes, and after the use of .enter() with .append()
two more nodes are added, so that now there are five data points and five nodes.
And there is a one to one mapping between a node and a datum.
The code in the file ex3.html contains additional examples to
show how we can use data that are of type string or object.
The code in the file ex4.html modifies the code in ex3.html
to allow the user to enter numerical values in the input box (as a sequence of numbers)
in order to update the "p" elements. You will see how this looks like a bar chart.
In orde to create a real bar chart, we need to learn a few more methods to transform our data. We do this in the second tutorial written by Lucy Shen '17.
D3 Resources
There is a lot of material on the web about D3, not all of it of good quality.
A good series of tutorials/screencasts have recently appeared in Dashing D3.js.
All tutorials in Mike Bostock's websites (see links in the Gallery bar at the top of the page) are very insightful, but they are not always at the beginner level.
Wikipedia's page on D3.js has a section on books about learning D3.js.
The complete (and very detailed) documentation for the API methods is a great resource.
And here is a more compact and easier to navigate API of D3 methods.