Assignment 1: Classifying Boundaries & Leveraging Innate Abilities to Support Recognition
This is the first of three assignments that will be given over the semester. Most of this assignment explores the representation of
object boundaries in a visual scene and use of boundary
information in object recognition. This part consists of a series of questions based on the following two papers:
(1) Nakayama, K., Shimojo, S., Silverman, G. H. (1989)
Stereoscopic depth: its relation to image segmentation, grouping, and the recognition of occluded objects,
Perception, 18, 55-68.
(2) Craft, E., Schutze, H., Niebur, E., von der Heydt, R. (2007)
A neural model of figure-ground organization, Journal of Neurophysiology, 97, 4310-4326.
The second paper is fairly long, so a list of the key parts of the paper to read carefully is provided in Appendix 1
at the end of this assignment handout. The last part of the assignment consists of one question related to the idea of leveraging innate visual
capabilities to learn about faces.
Questions are labeled short and medium, where "short" means that only a couple sentences are needed and "medium" means that a paragraph of a few sentences should suffice.
You are welcome to discuss the questions below with other students in the class, but should write up your own answers. This assignment is due on Friday, October 9. Your write-up should be submitted to the 9.523 course site on stellar using your private account: https://stellar.mit.edu/S/course/9/fa15/9.523/.
(1) Intrinsic vs. extrinsic contours and their role in face recognition
Nakayama et al. (1989) make a distinction between contours that are intrinsic vs. extrinsic to a
surface or object viewed in an image. Depth information derived from stereo vision is one visual cue that can be used to
determine whether a given edge contour in the image is intrinsic or extrinsic to an adjacent surface. Nakayama et al.
hypothesize that the distinction between intrinsic and extrinsic contours is important for the recognition of objects in the
presence of occlusion, in which parts of an object may be hidden from view or may appear disconnected in the image due to
occlusion. They present the results of a perceptual experiment on face recognition to test this hypothesis. The geometry
of the stereo projection of a scene onto the left and right images is illustrated in Appendix 2.
(a) (short) Explain in your own words, the meaning of intrinsic and extrinsic contours.
(b) (medium) What other visual cues, besides stereo, could be used to determine whether a particular boundary is intrinsic or
extrinsic to an adjacent surface region (provide at least two cues)? Describe briefly, how these cues could
be used to make this distinction. (Hints can be found in the Craft et al. (2007) paper.)
(c) (medium) Briefly summarize the results of the face recognition experiment. (A link to a sample stereogram similar to those used
in this experiment, shown as a color anaglyph, is provided in Appendix 2.) What do you think these results imply about the
computations leading to face recognition?
(2) A neural model for determining figure-ground organization
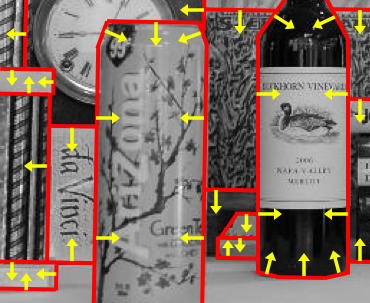
Craft et al. (2007) present a model whose development was inspired by physiological studies that suggest that some neurons in cortical area V2 in monkeys may explicitly encode the surface to which a given edge or boundary belongs. This information is illustrated in the image below, in which prominent object boundaries are highlighted in red and the yellow arrows indicate which of the adjacent surfaces "owns" the boundary:
(a) (short) Similar to many simple and complex cells in cortical area V1 in monkeys, some neurons in V2 are selective for edges of a
particular orientation within their receptive field. In the images shown in Figure 2 of the Craft et al. paper, edges are
defined by luminance changes. Referring to the neural signals shown in Figure 2, on what basis do the authors conclude that this
population of V2 neurons also encodes border-ownership (e.g., whether the edge in the receptive field shown in the images at
the top of the figure belongs to the surface on the left or right side of the edge)?
(b) (short) As portrayed in Figure 2 of the Craft et al. paper, the determination of border-ownership at a particular location in the image may
require the integration of information about the structure of the image over a large distance that extends well beyond the
receptive field of a single neuron. In some models of figure-ground segregation, this integration of information over large
distances is implemented through local interactions in a network or grid of neurons that propagate constraint from
one neuron to the next, over time and space. Why is this strategy not a valid model of the way border-ownership signals emerge in V2 cells?
(c) (medium) In the model proposed by Craft et al., border cells (B cells) are organized in pairs that are each selective for an edge of
the same orientation, but with opposite directions of border-ownership. As shown in Figure 3B of the paper, the B cells receive direct excitatory
input from a complex cell that signals an edge at a particular orientation. The B cells also receive inputs from so-called
end-stopped cells that respond to a configuration of edges that form a T-junction in the image. Briefly explain how such
edge configurations
provide constraint on border-ownership, and the rationale behind the particular connectivity shown in Figure 3B (including the use
of both excitatory and inhibitory connections).
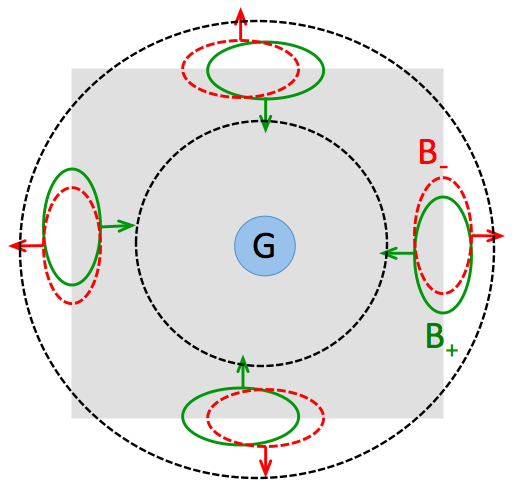
(d) (medium) In the Craft et al. model, integration of information about border-ownership over an extended spatial region is accomplished
by grouping cells (G cells). Consider the figure shown below. Four pairs of B cells are shown on the four edges of the square
object (the B cells within each pair are slightly offset from one another for visibility). The B cells shown in green signal
border-ownership toward the center of the square while the B cells shown in red signal border-ownership in the direction away from
the central square, as indicated by the arrows. Imagine a G
cell located at the center of the square, with an annulus-shaped receptive field indicated by the dashed black lines. A large
response from this G cell would implicitly signal the presence of a central figure. In the model, the B cells shown in green
have excitatory connections to the central G cell, and the activity of the G cell then inhibits the response of the B cells shown
in red. As a consequence, the response of the "green" B cells within each pair would "win out," reinforcing the representation of a central figure.
How does the proposed model achieve scale invariance, as illustrated in Figure 2 of the Craft et al. paper, in which the time it
takes to determine the correct border-ownership is independent of the size of the square?
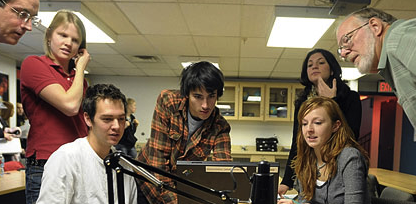
(e) (medium) What challenges might arise when applying a model such as that proposed by Craft et al. to a natural image such as the
one shown below, if the aim were to segregate the image into regions that correspond to distinct "objects"?
(f) (medium) This final question relates the ideas raised in the two papers. Some complex cells in area V1 are also selective for stereo disparity, which refers to the shift in position of corresponding features in the left and right eyes. Stereo disparity is related to the depth of the features in space, relative to the distance at which the observer is fixating. Consider the complex cells that form the input to the border cells (B cells) in the Craft et al. model. Suppose these cells also encode the depth of an edge in the image (e.g. 3D distance of the edge from the viewer). How might the model be extended to incorporate information about the depth of edges in the image, which, as noted by Nakayama et al., provides a more salient cue to the presence of object boundaries and determination of border-ownership?
(3) Leveraging Innate Visual Capabilities to Learn about Faces
The work described by Shimon Ullman leverages innate visual capabilities of infants, such as their ability to detect common
motion within image regions or detect motion discontinuities, to develop complex object concepts. This work is described in the following
two papers that were required reading for Week 2:
Ullman, S., Harari, D., Dorfman, N. (2012)
From Simple Innate Biases to Complex Visual Concepts,
PNAS, 109(44), 18215-18220.
Dorfman, N., Harari, D., Ullman, S. (2013)
Learning to Perceive Coherent Objects,
Proc. Annual Meeting of the Cognitive Science Society - CogSci, 394-399.
In the modeling work described in these papers, object concepts emerge through an iterative learning process that is largely unsupervised. In the case of hands, for example, the goal is to learn a visual representation that allows the observer to recognize hands under a wide range of appearances, e.g. with different hand configurations and poses, as well as different amounts of occlusion in cluttered scenes. The appearance of hands is learned through an iterative process that begins with the detection of simple "mover" events that allow the reliable detection of hands in very limited contexts. Additional hand configurations are then learned by tracking initial hand regions over time or inferring the presence of hands from their location relative to other body parts. This model of learning results in a rich database of hand appearances that yields performance approaching that of human observers.
(medium) This problem explores the application to face recognition, of this general approach to modeling the learning process. Imagine that in
addition to the basic motion capabilities
described in the Ullman et al. work, infants also begin with a simple template-like concept of a face, as described in Sinha et al. (2006)
Face Recognition by Humans: Nineteen Results all Computer Vision Researchers Should Know About. Result #15, described on page 1957 of this
paper, states, “The visual system starts with a rudimentary preference for face-like patterns,” such as that shown below on the left, which is
preferred by infants over the non-face figure on the right:


Suppose that infants are initially able to detect a large face-like image pattern in a frontal view, similar to what they may see from the arms
of their mother or other caregivers shortly after birth. Drawing from the work described by Ullman and Harari, how might this
innate face detection capacity, combined with the ability to detect common motion and motion boundaries, be used to create a more complex
representation of faces that allows an infant to detect faces under a wide range of appearances, including different poses and sizes, and
in cluttered scenes?
Appendix 1: Key parts of the Craft et al. (2007) paper
Much of the Craft et al. paper can be skimmed. To help you focus on the essential high-level ideas and avoid getting
bogged down in less critical details, unfamiliar terminology, and background studies, the following is a list of the most
important excerpts:
— first two paragraphs of the INTRODUCTION that begin with "Visual perception begins..." and "Although there is
evidence...", along with Figure 1
— two consecutive paragraphs on page 4311 that begin with "The present model is based..." and "In essence,
border-ownership..."
— first paragraph of the section entitled PHYSIOLOGICAL CONSTRAINTS on page 4312 that begins with "The recent
physiological results...", along with Figure 2
— subsection entitled, Overview of network structure on page 4314, along with Figures 3 and 4
— first two paragraphs of the subsection entitled, Grouping cell connections that begin with
"Each pixel of the connection..." and "Next, we determine which border-ownership...", along with Figure 5
— subsection entitled, Border-ownership cells, through page 4316 (you can skip the last paragraph of
this subsection that begins with "Decreasing the number of G cells..."
— first five paragraphs of the subsection entitled, Comparison with neurophysiology, along with
Figures 6 and 7
— subsection entitled, Model results: predictions on page 4318, along with Figure 9
— first paragraph of the subsection entitled DISCUSSION that begins with "Our network is constructed..."
– subsection entitled, Grouping and attention that begins on page 4322
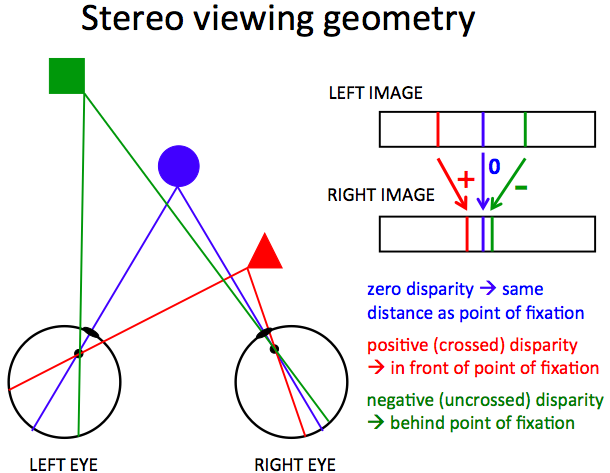
Appendix 2: Stereo projection geometry
In the literature, there are many definitions of stereo disparity, which refers to the difference in the projected location of a feature from the viewed scene onto the left and right eyes (or cameras). The diagram below illustrates the basic concept. On the left is a birds' eye view of the left and right eyes focused on a point on the blue circle. The lines show the projections of points in the scene onto the back of the eyes, including the fixation point (blue), a point on an object closer to the viewer (red) and a point further away from the viewer (green). On the right is a diagram of the left and right images shown with one above the other and with the three locations in each image depicted as extended bars. This visualization shows the difference in relative positions of the features in the left and right eyes, and one definition of the sign of stereo disparity based on the direction of shift in position between the two eyes. The words below the left and right images also indicate the relationship of stereo disparity, as measured in the images, to the relative position of the features in depth.
This webpage shows a stereogram that is similar to those used in the Nakayama et al. (1989) paper, but displayed as a color anaglyph that should be viewed with special glasses that have a red filter over one eye and green filter over the other (see Ellen for a pair of red/green glasses if you missed the demonstration in class). When one eye views the stereogram through a red filter while the other eye views the stereogram through a green filter (or vice versa), the two eyes see different images. When fused stereoscopically, a percept emerges of a face with horizontal strips appearing either in front or behind the face, depending on whether the red filter is placed over the left or right eye.