Small and Large Scale Banking
World Bank
PayPal
Venmo
Brick-and-Mortar
OverView
Our project examines banking interactions on small and large scales. World Bank system and money-sending applications, such as Venmo, PayPal, and CashApp. On a small scale, we are researching social spending between people in comparison to face-to-face interaction with bank tellers in brick-and-mortar banks. On the large scale, we want to analyze public knowledge of the World Bank and its interactions, as well as how social bias can influence it. 118 people have completed our survey.
Our Survey.Response Demographics
Responses per State
| Massachusetts | 62 |
| North Carolina | 22 |
| New York | 17 |
| Illinois | 1 |
| Rhode Island | 3 |
| Florida | 1 |
| Georgia | 3 |
| Ohio | 1 |
| Washington, D.C | 1 |
| Connecticut | 1 |
| South Carolina | 1 |
| Kansas | 1 |
| Pennsylvania | 1 |
International Responses
| Panama | 1 |
| Canada | 1 |
| England | 1 |
Education Level
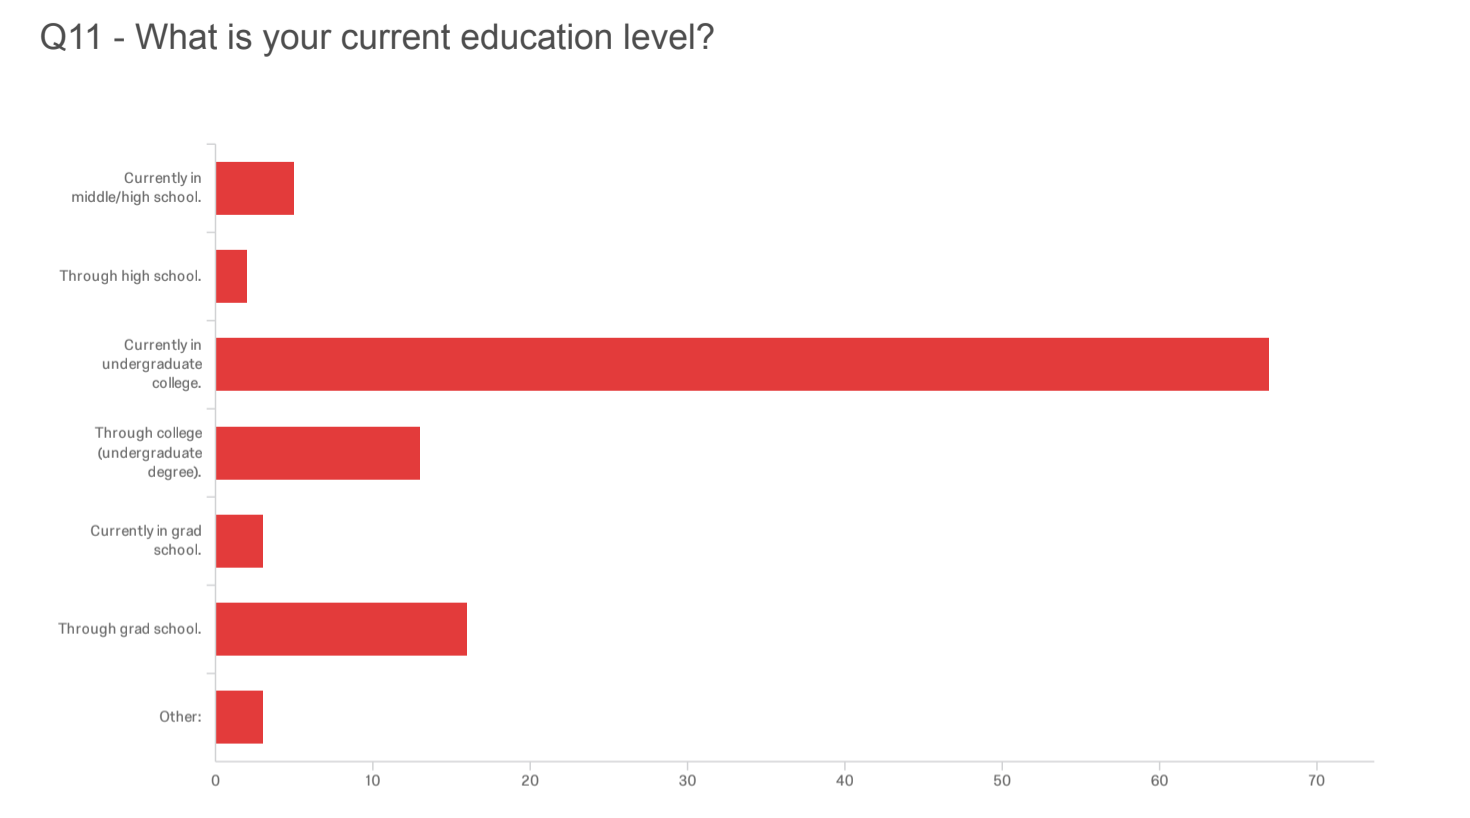
The majority of our survey responders are pursuing their undergraduate degrees. This does not necessarily mean that only this demographic is interested in our topic. These people could have also been more inclined to take our survey as well. However, we cannot correlate these responses with age because there are different standards of education levels depending on one’s background. However, those who filled out our survey are those most likely to view our website, so we should make sure that we appeal to this audience in the type of background information we give and the language we use in our text explanations.
Age
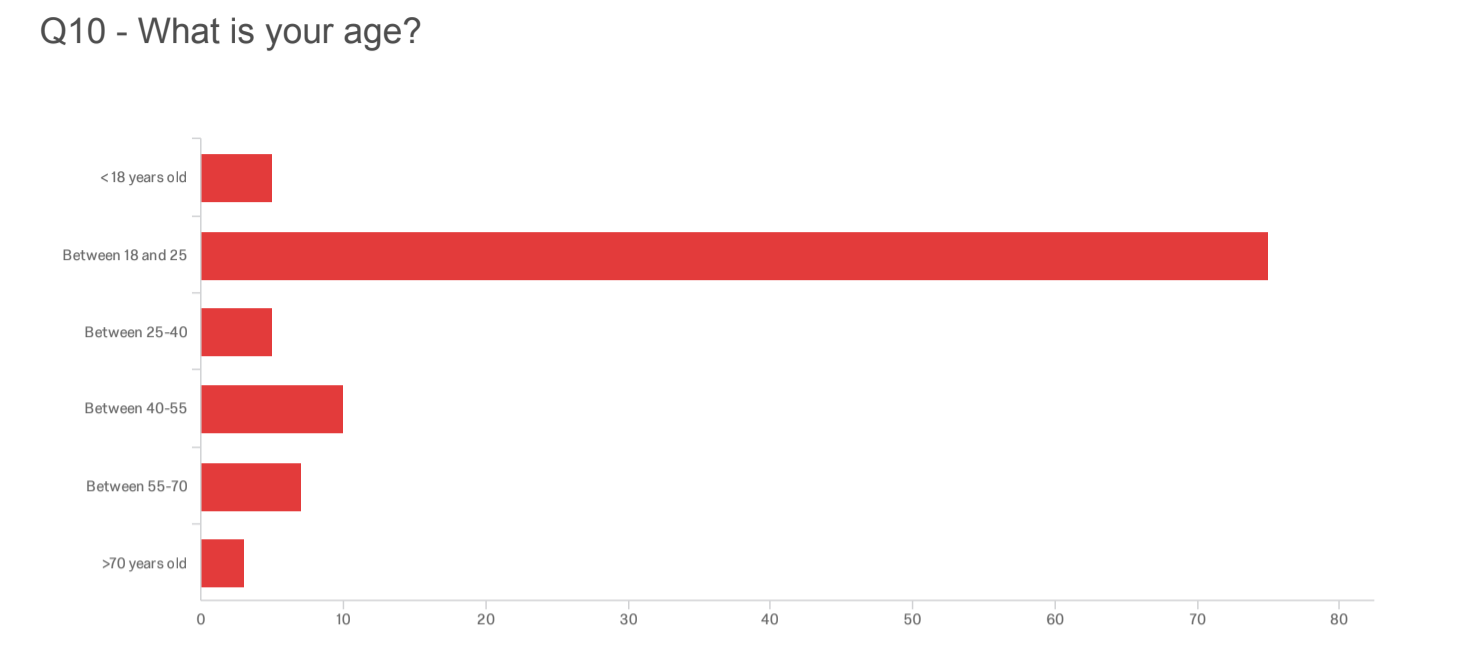
The people who filled out our survey at the highest rate are between 18 and 25 years old. This is important in understanding who will be most likely to view our website as well. This could be helpful in looking at trends that this age demographic respond best to, in terms of websites. Again, this does not necessarily relate to education level or other demographic information.
Online Banking Platforms
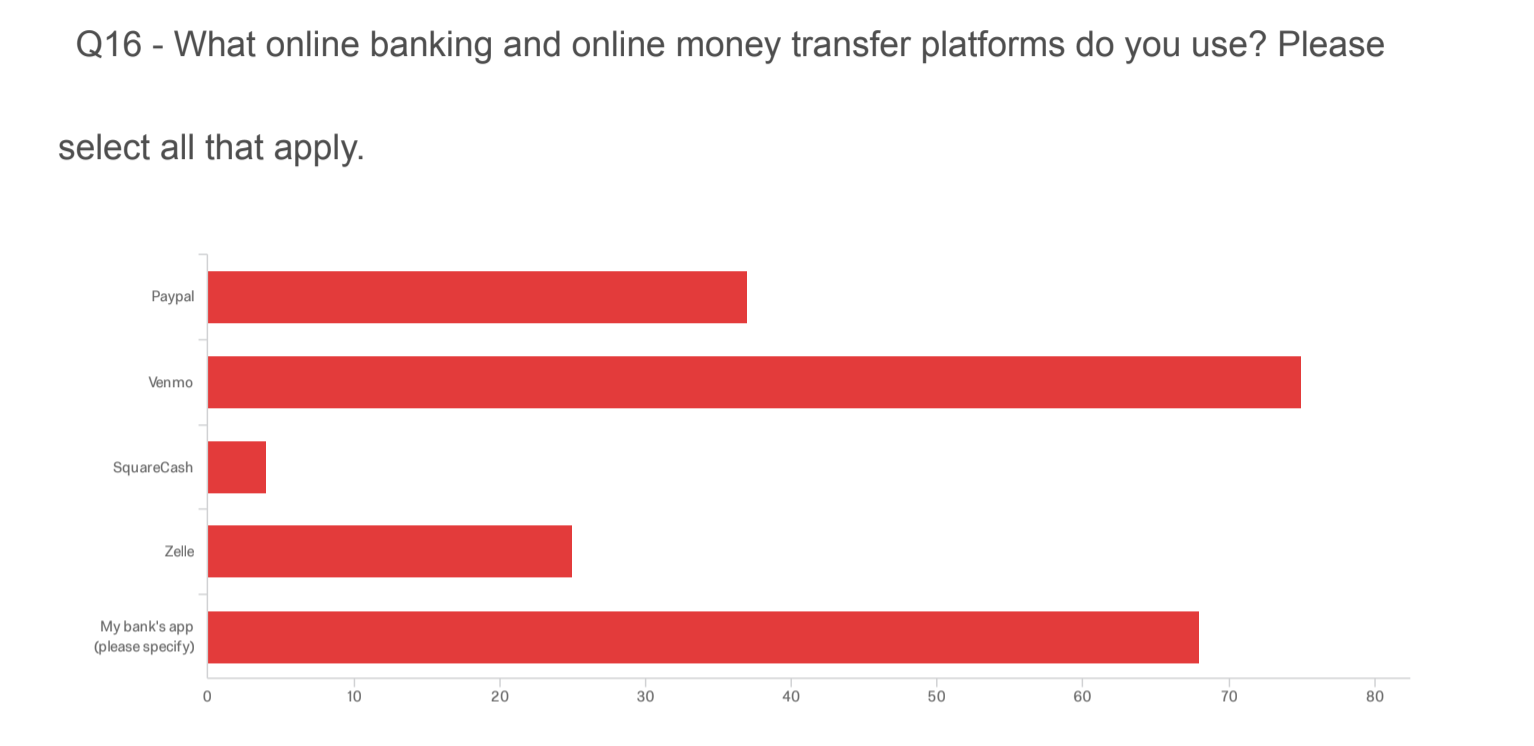
The most used money transfer/banking app was Venmo, closely followed by the bank apps used by our survey responders. Some of the bank apps that our survey responders use are Bank of America, Cashapp, CapitalOne, TD Bank, PNC, among others. Less than half of our survey responders use PayPal, which was surprising considering that many online shopping websites also accept this form of payment. In addition to this, PayPal allows the user to transfer funds to other PayPal users, similar to the function of Venmo.
World Bank
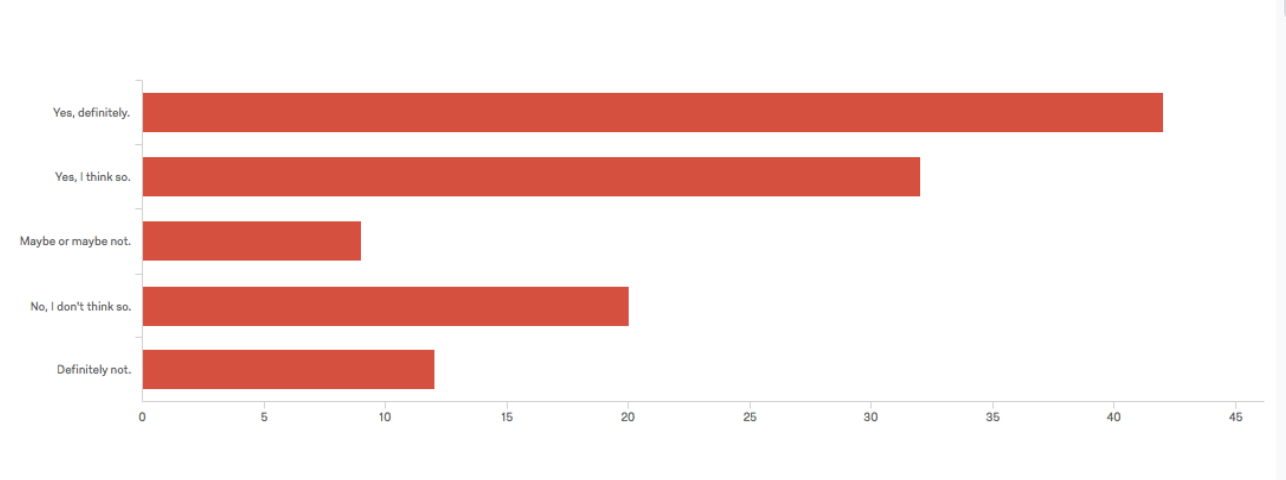
In order to figure out what type of background information we would need to apply to World Bank research, we asked the question: “Have you ever heard of the world bank?” 74 out of our 118 responses responded that they probably or definitely had heard of the World Bank, while the rest were unsure or had not heard of the bank. Based on the results, which were generally spread out over the range from “Yes, definitely” to “Definitely not”, we concluded that we should have a short background about what the World Bank is before then drawing to the large-scale banking and loan transactions that scale from the World Bank.
Trust in Banks
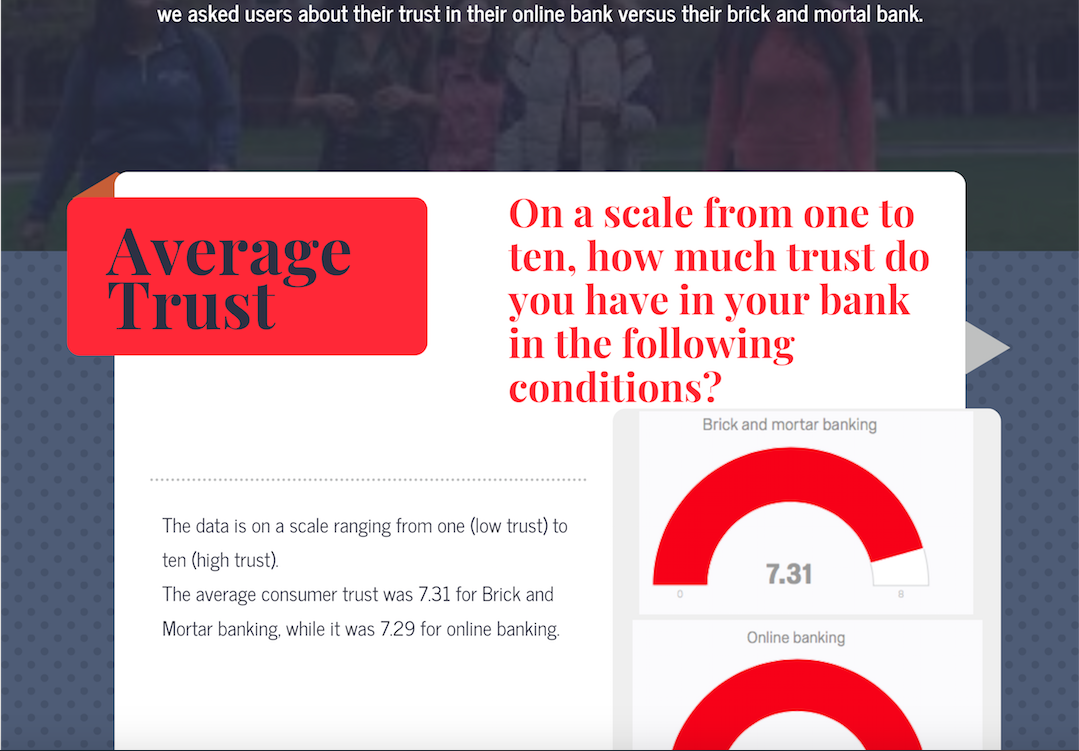
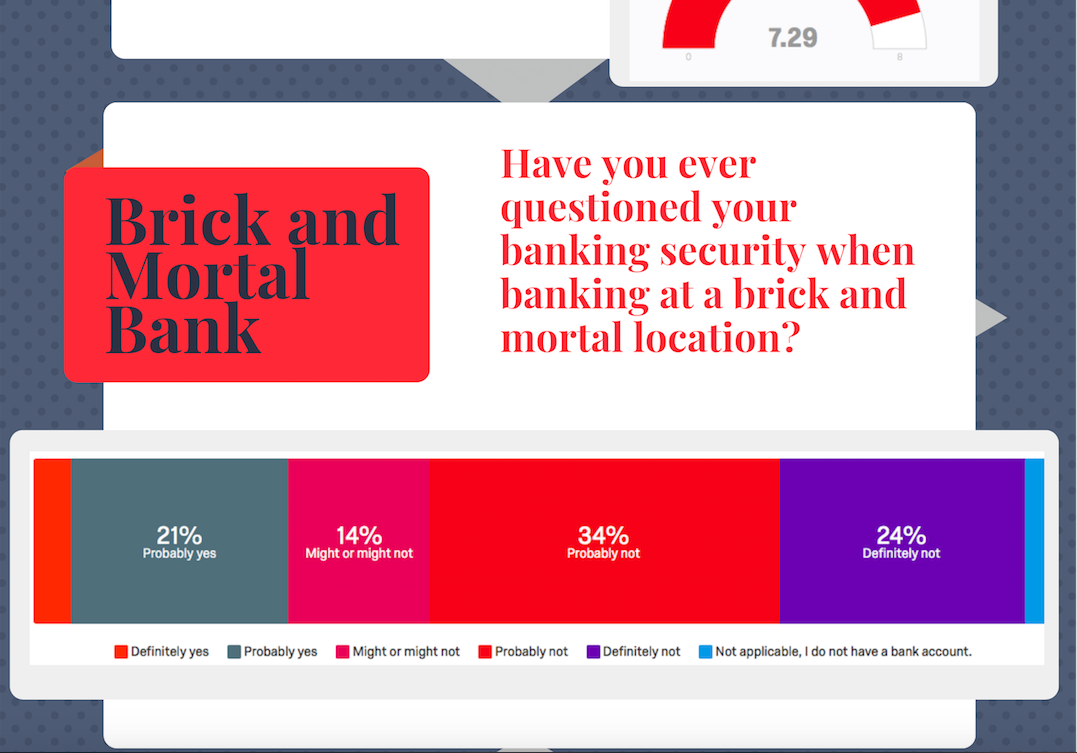
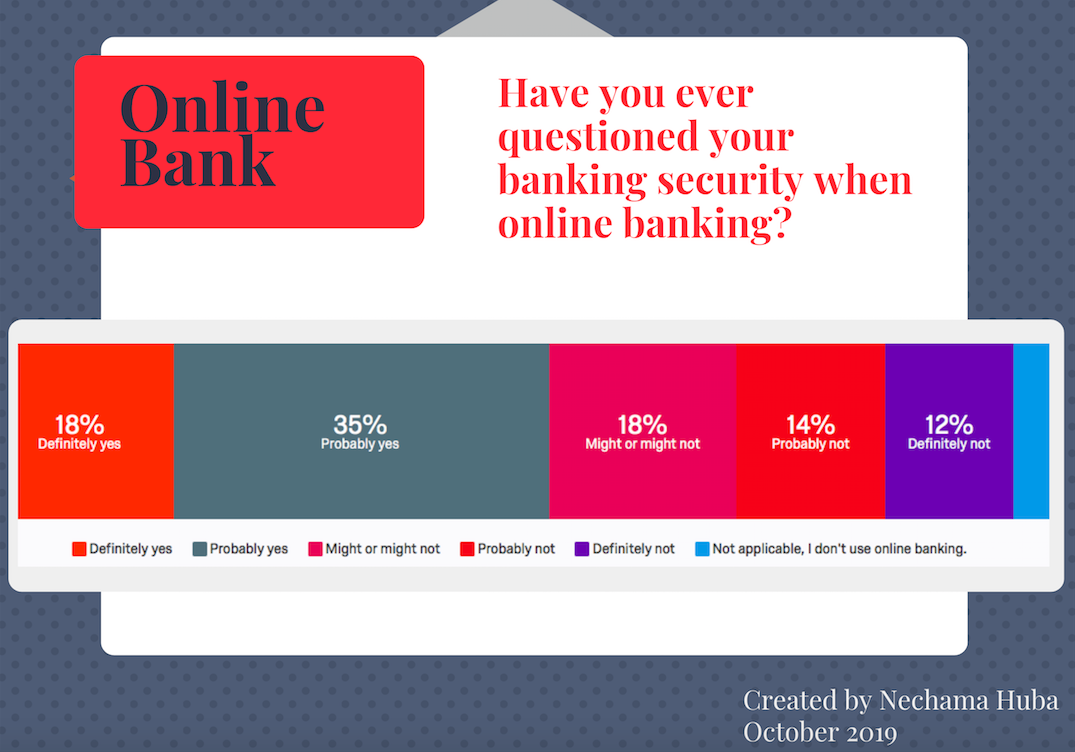
Although the average trust was relatively similar for the average consumer trust in both types of banks, the trust in brick-and-mortar banks was higher by .2 on a scale than the average trust for online banks. Although the average trust graphic is informative, the differences in trust levels are more clearly indicated with a breakdown of answers, as shown in the second and third graphics within the infographic. The most noticeable difference in trust between the two was that out of the 118 responses we received, 4% responded “Definitely yes” when asked if they have ever questioned their banking security at a brick and mortar bank. This is a stark difference in comparison to the 22% of surveyed individuals who responded “Definitely yes” in regards to questioning their online banking security. On the other side of the trust spectrum, 24% of people responded that they “Definitely not” have questioned their banking security in a brick and mortar location whereas only 12% of people responded that they “Definitely not” have questioned their online banking security. This reveals a key finding in our research- that there is a disparity in consumer trust between online banking and in-person banks.
Bank Visitation
Weekly Online Visits

Weekly Brick-and-Mortar Visits
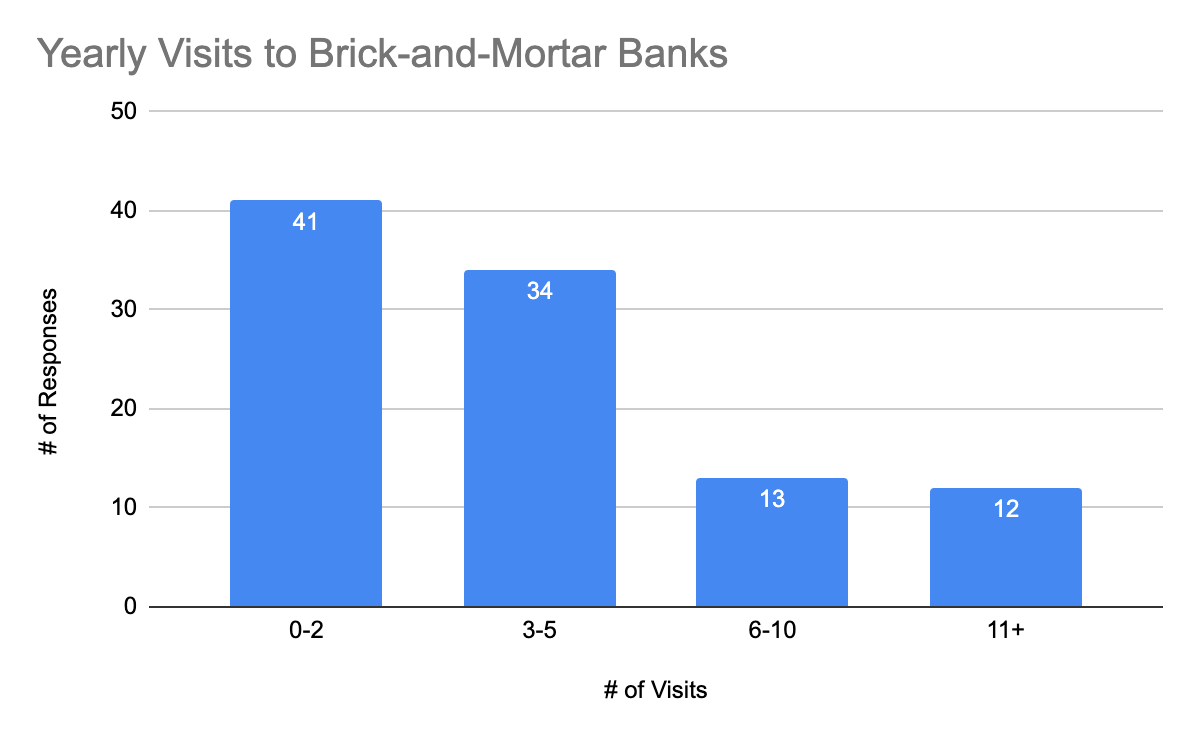
There was a range in the number of weekly visits to online banking platforms, but the majority of survey responders visit these platforms between 0-2 times a week. However, this is a weekly time period and if someone is visiting these platforms at this rate, there is a much higher amount of traffic on these platforms during the year, or even just in one month. The number of people who visit a brick-and-mortar bank, also known as the physical building of a bank, per year is fairly close to the number of people who visit an online banking platform (there is a difference of 15 responses). However, when keeping these results in mind, not every question was responded to by the total number of survey responders, which may have affected our results. The total number of survey responders this data was analyzed was 118, which is not always equal to the sum of responses for each survey question.
Website Formatting
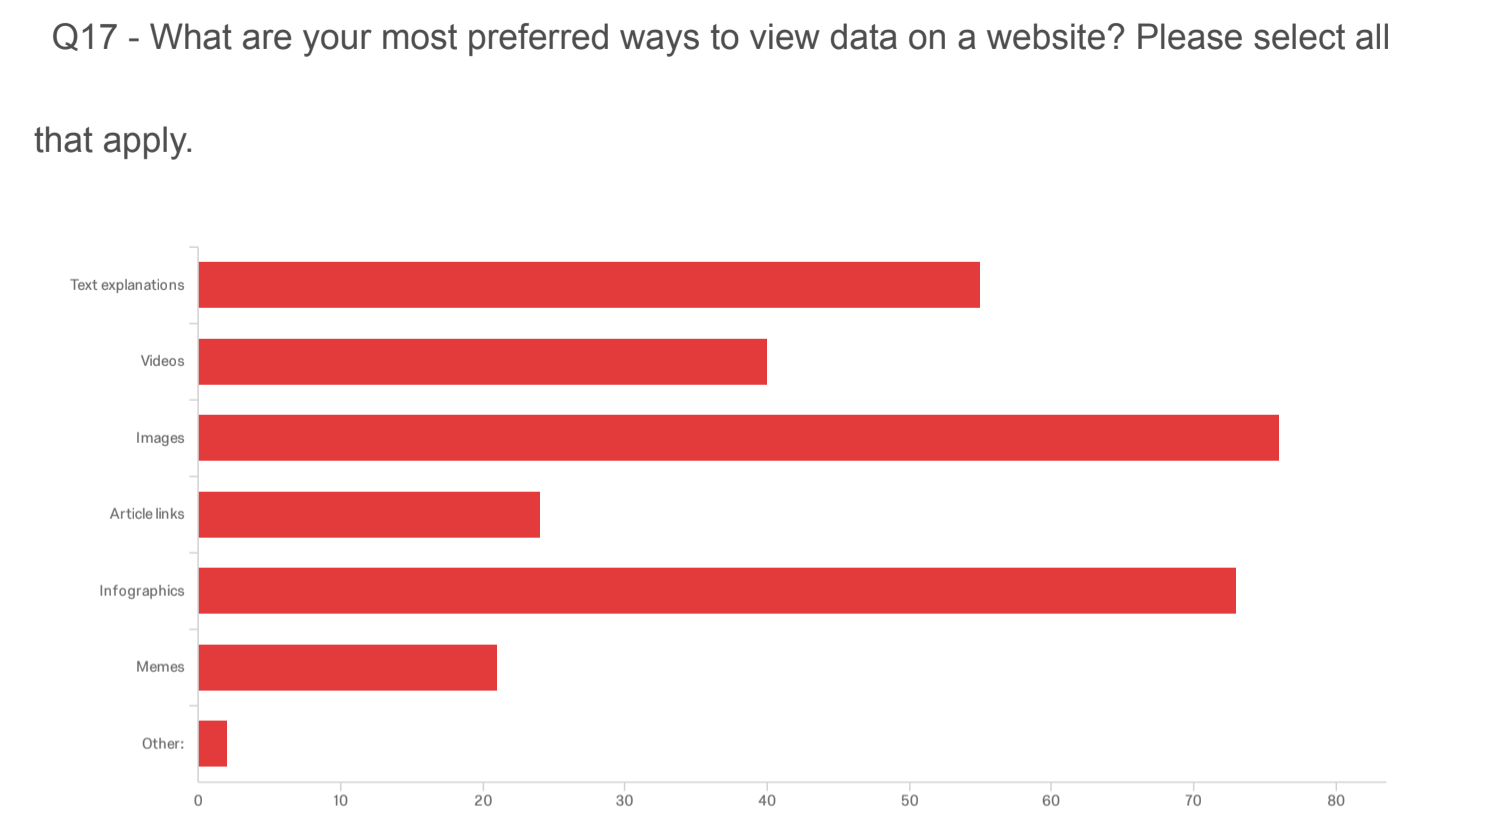
The most preferred way to view data on websites by our survey responders are images, closely followed by infographics. These responses tell us as website creators that we should include many images and infographics. (You can see this in action on this page!) We also had over half of the survey responses for this question indicate a preference for text explanations on websites. When linking to an infographic or image on our website, we will accompany them with text explanations to help contextualize the information in said infographic/image. (Also seen on this page!) As a team, we may consider creating a video to give information on our website, but it wasn’t as high in demand as the other website formats we gave as options in the survey question.
OverView
Our target audience for this research are mobile banking users and those with bank accounts. Anyone with access to a financial institution can be affected by our study. One of the questions we aim to answer is how similar is the frequency of online banking platform usage vs physical bank usage. We will also answer how bias affects the world bank, whether individuals trust it, and their knowledge of it. This will be delivered through data synthesis and infographics.