
Assignment 5

|
|
CS 112
Assignment 5 |
|
You can turn in your assignment up until 5:00pm on 11/3/06 without
penalty, but it is best to hand in the assignment at the beginning of
class. Your hardcopy submission should include a cover sheet and printouts of 7 code
files: findPeaksAndValleys.m, anagram.m, translatecodon.m,
rna2amino.m, translateRNA.m, chiSquare.m, and
whichLanguage.m. The cover page includes the number
of points that each exercise and problem is worth, written in
parentheses in the table. Your electronic submission is described in
the section Uploading your saved work
assign5_programs folder from the cs112d directory
onto your Desktop. Rename the folder to be yours, e.g. sohie_assign5_programs.
In MATLAB, set the Current Directory to your assign5_programs folder.
drop/assign5 folder
assign5_programs folder into your
drop/assign5 folder
assign5_programs folder from the Desktop by dragging
it to the trash can, and then empty the trash (Finder--> Empty Trash).
When you are done with this assignment, you should have 7 code files stored in
your assign5_programs folder: findPeaksAndValleys.m, anagram.m,
translatecodon.m, rna2amino.m, translateRNA.m, chiSquare.m, and
whichLanguage.m.
 |
 |
 |
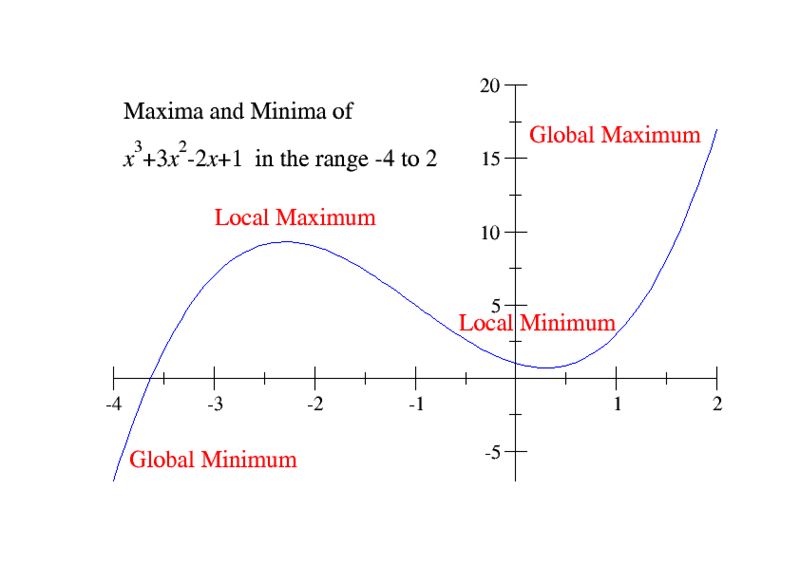
findPeaksandValleys that will take one input parameter. The input will be a 2D matrix of data (that we will provide, see below). Your function will determine where the local minima and maxima are and print out their locations.
In this problem, a local minimum is defined as a value in the matrix being smaller than
the values above it, below it, to the right and left of it. In order to be a local minimum/maximum, a value must have four neighbors (above, below, left and right). Two examples with the local minimum are shown in green below. Each 3x3 figure represents a subset of a 2D matrix.
|
|
A local maximum (each pink cell below), on the other hand, is a value that is greater than its surrounding neighbors.
|
|
In your assign5_programs folder, there is a file called
setUpPeaksAndValleys.m that sets up and returns the 2D surface matrix.
You'll notice that
setUpPeaksAndValleys also plots the surface in 3D.
You will write findPeaksAndValleys to determine the locations
of any local minima and maxima and print out those locations.
When you run findPeaksAndValleys, your output should look something like this:
>>
>> findPeaksAndValleys(setUpPeaksAndValleys)
valley at row 8, col 17
peak at row 12, col 13
peak at row 15, col 22
valley at row 16, col 9
valley at row 17, col 17
peak at row 23, col 15
>>
| elvis | lives | |
| listen | silent | |
| orchestra | carthorse | |
| Angered | Enraged | |
| deductions | discounted | |
| 'Astronomers ' | 'Moon starers' |
Note: There is an extra space after Astronomers that is used between the words in the corresponding anagram
For a pair of words or phrases to be an anagram, they must use the exact same letters and spaces, but simply in a different order.You will write a MATLAB function called anagram.m that will take two
words/phrases as input, determine whether the two words or phrases are anagrams,
and print an appropriate message. Your anagram function does not need to return
a value, but it does need to print a message indicating whether or not the two
inputs are anagrams. Your output should also print the two words/phrases that were supplied as inputs to anagram.
Here is some sample MATLAB output:
>>
>> anagram('elvis','lives')
elvis and lives are anagrams
>>
>> anagram('listen','silent')
listen and silent are anagrams
>>
>> anagram('matlab', 'never ending fun')
matlab and never ending fun are not anagrams
>>
>> anagram('Tom Cruise ','So Im Cuter')
Tom Cruise  and So Im Cuter are anagrams
>>
>> anagram('The Morse Code', 'Here come dots')
The Morse Code and Here come dots are anagrams
>>
>> anagram('The Morse Code ', 'Here come dots')
The Morse Code  and Here come dots are not anagrams
>>
>> anagram('Angered','Enraged')
Angered and Enraged are anagrams
>>
>> anagram('matlab','matlab')
matlab and matlab are not anagrams
>>
Some things to note in the above output:
anagram.m detects anagrams independent of case (see 'Angered' and 'Enraged')
anagram.m prints the original words/phrases as they
were supplied to the anagram.m function

How does RNA specify the amino acid sequence?
There are 4 nucleotides and 20 amino acids. Each amino acid
is specified by a particular triplet of nucleotides, called a codon.
The four nucleotides are represented by A, C, G or U (standing for adenine,
cytosine, guanine and uracil, respectively). The 20 amino acids
are abbreviated as Phe, Ser, Gly, etc. There are three codons (UAA, UAG and UGA) that act as signals to terminate translation, and these are called STOP codons.
Given a RNA nucleotide sequence, we can calculate the amino acid sequence of the resulting protein, reading off one codon at a time from the RNA. For example, 'GUCACCUAA' would translate into ValThrStop. The table that translates from a triplet of nucleotides (a codon) to one amino acid is given below (and is on page 178 of the Kaplan text):
| first position | second position | third position | |||
| U | C | A | G | ||
| U | Phe | Ser | Tyr | Cys | U |
| U | Phe | Ser | Tyr | Cys | C |
| U | Leu | Ser | Stop | Stop | A |
| U | Leu | Ser | Stop | Trp | G |
| C | Leu | Pro | His | Arg | U |
| C | Leu | Pro | His | Arg | C |
| C | Leu | Pro | Gln | Arg | A |
| C | Leu | Pro | Gln | Arg | G |
| A | Ile | Thr | Asn | Ser | U |
| A | Ile | Thr | Asn | Ser | C |
| A | Ile | Thr | Lys | Arg | A |
| A | Met | Thr | Lys | Arg | G |
| G | Val | Ala | Asp | Gly | U |
| G | Val | Ala | Asp | Gly | C |
| G | Val | Ala | Glu | Gly | A |
| G | Val | Ala | Glu | Gly | G |
* Not really. Just a joke.
| lab | seat | row | ||
| A | B | C | ||
| 8 | 'Sarah' | 'Sharon' | 'Mimosa' | 1 |
| 8 | 'Laura' | 'Jessica' | 'Randy' | 2 |
| 8 | 'Abby' | 'Donald' | 'Goofy' | 3 |
| 9 | 'Becca' | 'Miranda' | 'Breanna' | 1 |
| 9 | 'Emmi' | 'Ashley B' | 'Ashley H' | 2 |
| 9 | 'Judy' | 'Sadia' | 'Mona' | 3 |
For example, '8C2' gives Randy's assigned seat for the rest of the semester (8am lab, seat C in the second row). There is a mapping that exists from labtime, seat and row to cs112 student. One method of simplifying the mapping is to collapse our table into one long line of data, and then use an index to access the data. We have 3 aspects of our seating chart: lab time, seat and row. What if we assign labtime 8 to 0 and labtime 9 to 1; seats A, B and C to 0, 1 and 2, respectively, and row we leave intact. Then we can figure out who is in which seat by the following formula:
studentindex = 3*time + 6*seat + row
Let's look at the formula more carefully.
Why are we multiplying time by 3?
And why seat by 6?
If we collapse all the names into one long vector by columns like this:
names = {'Sarah','Laura','Abby','Becca', Emmi', 'Judy','Sharon', ...}
then we can use studentindex to index our names cell array and
retrieve the student's name, given her seat assignment.
This seating chart example is intended to be a guideline for helping you if you choose to translate from RNA nucleotides into amino acids by using indexing (rather than brute force conditionals).
translatecodon that takes a codon string as input and returns the corresponding amino acid given in the table above.
rna2amino that takes a
sequence of RNA nucleotides (e.g. 'GUCACCUAA') and a starting point and translates the entire
sequence into a sequence of amino acids (e.g. 'ValThrStop'). rna2amino
will call translatecodon.
translateRNA.m that will step
through a list of sequence samples in a text file called
sequences.txt and print the translation of each sequence into amino acids. You will
find the file sequences.txt in your assign5_programs
folder. The textread function can be used to read the lines of text of this
file into a cell array.
translateRNA:
>>
>> translateRNA
sequence 1: Val Thr Stop
sequence 2: Ala Leu Cys
sequence 3: Ile Met Ala Trp Thr StopLys
sequence 4: Tyr Leu Ser Ile Tyr Leu Ser Ile
sequence 5: Leu Tyr StopSer Leu StopGln
sequence 6: Gln Thr Val Glu Arg Ala Leu
sequence 7: Arg Cys Arg Ala Thr Leu Arg Val Ser
>>
>>
The frequency of occurrence of different letters of the alphabet varies across languages and can be used to identify the language in which a particular selection of text is written. The following tables show some data on the frequency of occurrence (listed as percentages) of the nine most common letters in six languages:
| English | German | Finnish | French | Italian | Spanish | ||||||||||||||||||||||||||||||||||||||||||||||||||||||||||||||||||||||||||||||||||||||||||||||||||||||||||||
|
|
|
|
|
|
In this problem, you will complete a program that uses the above data to identify the
language in which a sentence is written. There are two code files in the assign5_programs
folder for this problem. The setUpTables.m script file constructs a cell array named
languages that stores the information in the above tables. The
languages cell array consists of 6 nested cell arrays that each contain three
elements: the name of the language, a vector of the 9 most common letters, and a vector of
the expected frequencies of occurrence of these 9 letters. The testSentences.m
script file contains testing code for your program. This file first constructs 6 strings of
letters that are not real sentences, but just contain the right proportion of the most common
letters for each language. These strings are just for testing whether your code is working ok.
The file then creates a few real test sentences from different languages. The
whichLanguage
function, which you will write, is then called with each of the test sentences.
To complete this program, you should write two functions, whichLanguage and
chiSquare. The whichLanguage function should have two inputs:
a string of text and the cell array of language data that is created by the
setUpTables script. It should have a single output that is the name of the
most likely language for the input string. For each language, this function should first count
the number of occurrences in the input string, of the 9 most common letters for this language.
From these counts, you can then
determine the frequency of occurrence of each of these 9 letters in the
input string. The observed frequencies of occurrence can be compared to the expected
frequencies for this language, to determine how well the input sentence fits the expected
data for this language. This last step can be accomplished by calculating the
Χ2
(Chi-Squared) statistic between the observed and expected frequencies, described below. The
most likely language for the input sentence is the one with the smallest value for the
Χ2 statistic.
Suppose you are given a vector E of the expected frequencies of occurrence of particular events (in this case, the appearance of certain letters in a text string) and a second vector O that contains the observed frequencies of occurrence. The Χ2 statistic captures the difference between O and E, and is measured as follows:
Χ2 = Σ (Oi - Ei)2/Eiwhere the sum is taken over the set of frequencies. Write a separate function chiSquare
that has two vector inputs corresponding to the observed and expected frequencies, and returns the value
of this statistic.
When you have completed these two functions, you can run the testing code in the
testSentences script to identify the languages for the examples.