Assignment 6
![]()
|
|
CS 112
Assignment 6
|
|
You can turn in your assignment up until 5:00pm on 4/1/10 without penalty, but it
is best to hand in the assignment at the beginning of class.
Your hardcopy submission should include a cover sheet, printouts of two code
files: drawGUI.m and popGUI.m, and a hardcopy
of a picture created with the GUI sketchpad that you construct for Problem 1. Your electronic
submission is described in the section Uploading your saved work
assign6_programs in the name, e.g. sohie_assign6_programs.
In MATLAB, set the Current Directory appropriately.
drop/assign6 folder
assign6_programs folder into your
drop/assign6 folder
assign6_programs folder from the Desktop by dragging
it to the trash can, and then empty the trash (Finder--> Empty Trash).
When you are done with this assignment, you should have four files stored in
your assign6_programs folder: two M-Files, drawGUI.m
and popGUI.m, and two .fig files, drawGUI.fig and
popGUI.fig.
In this problem, you will build a GUI sketchpad that might look something like this when complete:

To begin, enter guide in the Command Window to start the Layout Editor
for the MATLAB Graphical User Interface Development Environment. A GUIDE Quick
Start window will appear with Blank GUI (Default) selected. Click
the OK button. A Layout Editor window will appear (image shown below), titled
untitled.fig (when you save your GUI for the first time, name it
drawGUI). Select Preferences... from the File menu, and in
the Preferences window, check the box labeled Show names in component
palette and click the OK button. You are now ready to create your
first GUI!

First, you're going to design the physical layout of your sketchpad, using the components listed below. The GUI image above is just a sample -- you are free to layout your own GUI as you wish.
Axes: drawing window
Popup Menu: menu to select square, circle or triangle
Edit Text: text boxes with labels where the
user can enter the following information:g:*
Static Text: text label for picture name
Checkbox: to set linewidth to 1 (if not checked) or 2 (if checked)
Toggle Button: to specify hold on or hold off
Push Button: buttons for each of these actions: String property specifies the text string that will appear on the component
Tag property specifies a name that will be used to refer to this component
in your GUI code
ForegroundColor, BackgroundColor, FontSize
.m file and .fig files are intertwined:.fig file, the .m is automatically updated to include the new component.
drawGUI as the file name. MATLAB will also save the Layout Editor
figure as a .fig file, e.g. drawGUI.fig.
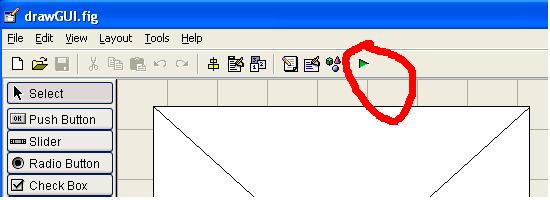
drawGUI in the Command Window, or selecting Run
from the Tools menu.
guide drawGUI.fig in the Command
Window
Once you have your GUI components laid out, you can then modify the
drawGUI.m code file to perform actions in response to
each of the GUI components. Recall that MATLAB automatically generates
code for each GUI component in your drawGUI.m file. First, modify the
drawGUI_OpeningFcn function (executed when the GUI is
first created) by constructing fields of the handles
structure that store all of the information that needs to be shared
across the GUI components:
Your next step is to modify the Callback functions for the components that have an immediate visual effect in your GUI. For example, the plot button has an immediate effect when pressed in the GUI. For the other GUI components that do not have an immediate visual effect (e.g., x position, y position, etc), MATLAB automatically keeps track of the current values of the user-entered strings.
Edit Text component for picture name: modify the Static Text
string that appears
below the drawing area, using the text that the user entered in the Edit Text box.
Remember that you have access to all of the GUI components through the input handles
structure and can read and modify the state of these components with the set and
get functions.
Toggle Button: set hold on or hold off,
depending on the state of this button, and also adjust the text string that appears on this
button in the GUI display
Push Button components: for the plot button, call the plot
function to plot the selected figure (square, circle or triangle) in the drawing window, using the
current settings for the x and y position, size, line style and linewidth. Also modify the
field of the handles structure that stores the vector of plots in the current
display, in order to support the undo operation.
For the undo button, delete the last plot drawn and update the
handles structure appropriately.
For the close button,
execute the following statement: delete(handles.figure1)
handles structure must include the following statement at the end:
guidata(hObject,handles)
handles structure from within the Callback function for the plot
button.
disp function.
These values will be printed in the Command Window.
drawGUI.m and drawGUI.fig files
in the assign6_programs folder that you submit electronically.
Population growth refers to how a population increases or decreases over time. This growth is controlled by the birth and death rates of the population. If a population has a constant birth rate over time and is never limited by factors such as food or disease, it exhibits exponential growth, which is captured mathematically by the following equation:
pt+1 = r * pt
where pt is the population in generation t, pt+1 is the population in generation t+1, and r is the growth rate between generations.
Real populations are limited by factors such as food and disease, creating an upper limit on the size of the population that the environment can support. Ecologists refer to this as the carrying capacity of the environment. The type of growth that occurs in this scenerio is referred to as logistic growth and is captured mathematically by the following equation:
pt+1 = r * pt * (K - pt)/K
where K is the carrying capacity.
In this problem, you will create a GUI based program that allows you to visualize the
results of simulating these two types of population growth for different values of the
parameters. The following is a sample GUI display for this program, named popGUI
(your GUI does not need to be laid out in exactly the same way):

The display area on the left shows two individuals (randomly positioned dots) in an
initial population in the first generation. The three text boxes allow the user to enter
values for the growth rate, carrying capacity, and number of generations to be simulated.
The button labeled logistic is a toggle button that is used to select the
exponential or logistic models. The close button closes the window and
terminates the program. The remaining three buttons cause the following actions to be
performed:
step: simulate one generation of growth using the selected model, add the
new individuals (randomly positioned dots) to the population display, and in the display
area on the right, graph the populations vs. generations for all of the generations so far
run: simulate multiple generations of growth, using the number of
generations that the user entered in the generations textbox. For each generation,
perform the actions listed above (add new individuals to the population display and graph
the population vs. generation for all of the generations so far). The pause
function can be used to create a pause between generations, for example,
pause(0.5) creates a half-second pause.
reset: return the program to the state displayed above, where there is
just a single generation of two individuals and the display area on the right is cleared
The following display shows the results after a simulation of 25 generations of the logistic growth model:

Some tips on completing your program:
handles structure: the number of generations simulated so far, and a vector of
the populations computed for these generations. This information should be initialized in
the popGUI_OpeningFcn function and modified in the Callback functions for
the step, run and reset buttons.
guidata function inside any Callback function that modifies the handles
structure.
Axes) can be given Tag properties in the same
way as other GUI components. The axes function can be used to specify which
display area to direct graphing operations. Suppose the display area on the left has the
Tag property populationAxes. The following statement will cause graphing
operations to be directed to this area:
axes(handles.populationAxes);
Once an axis is specified, all graphing operations (e.g. calls to axis, hold on,
hold off, fill, plot, etc.) will be directed to the populationAxes
display area.
Edit Text boxes
step and run buttons. The run
button just repeats the actions of a single step multiple times.
rand(1) can be used to generate a random number between
0 and 1, which can be used to calculate random x and y coordinates for dots in the
population display.
popGUI.m and popGUI.fig files
in the assign6_programs folder that you submit electronically.