
Assignment 8

|
|
CS 112
Assignment 8 |
|
You can turn in your assignment up until 5:00pm on 4/27/07 without
penalty, but it is best to hand in the assignment at the beginning of
class. Your hardcopy submission should include a cover sheet and a printout of mriGUI.m. Your electronic
submission is described in the section Uploading your saved work
assign8_programs in the name,
e.g. sohie_assign8_programs. In MATLAB, set the Current
Directory to your assign8_programs folder.
drop/assign8 folder
assign8_programs folder into your
drop/assign8 folder
assign8_programs folder from the Desktop by dragging
it to the trash can, and then empty the trash (Finder--> Empty Trash).
When you are done with this assignment, you should have five (5) files
stored in your assign8_programs folder: mriGUI.m,
mriGUI.fig, mri.mat, transformView.m and loadinData.m.
Recall the text-based interactive program you wrote for Assignment 5 that allowed the user to choose various MRI slice views. In this assignment, you will create a GUI for that program, and add some more features to your program.
The demo below shows one possible interaction in MATLAB's command
window of how the Assignment 5 program may have worked:
 >> mri
    Welcome to my program!
    Enter 1 to show all images at once
          2 to display a horizontal slice
          3 to show all frames as a movie
          4 to display a sagittal slice
          5 to display a coronal slice
          e to exit
   ==> 1
     Enter 1(all), 2(horiz.), 3(movie), 4(sag.), 5(cor.) or [e]xit
   ==> 2
    Select a horizontal slice bottom->top [1-27]: 15

     Enter 1(all), 2(horiz.), 3(movie), 4(sag.), 5(cor.) or [e]xit
   ==> 3
     Enter 1(all), 2(horiz.), 3(movie), 4(sag.), 5(cor.) or [e]xit
   ==> 4
     Select a sagittal slice left->right [1-128]: 80

     Enter 1(all), 2(horiz.), 3(movie), 4(sag.), 5(cor.) or [e]xit
   ==> 5
     Select a coronal slice front->back [1-128]: 75
   ==> e
>>
>>
Your mriGUI for this assignment might look something like this when complete:
Figure 1
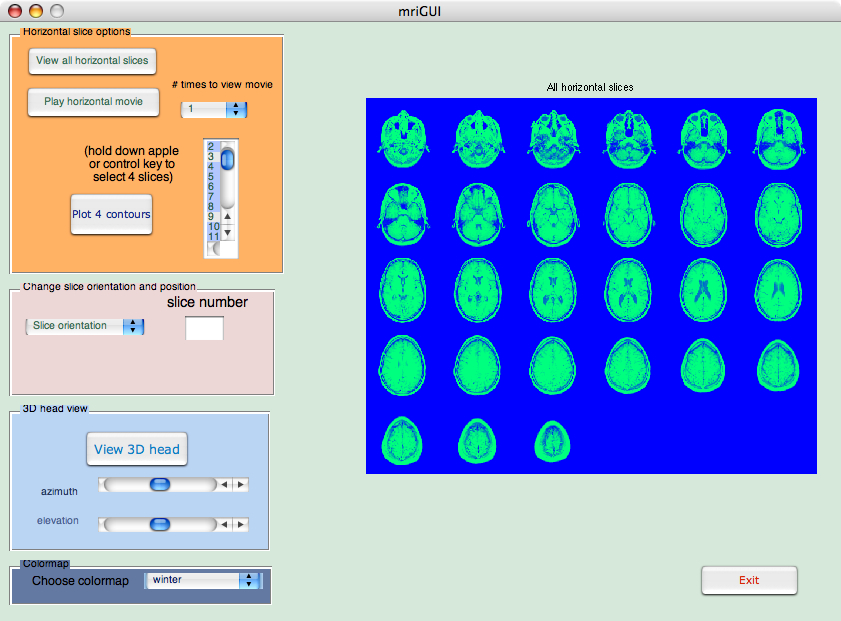
The diagram above is meant only as a guideline. You can choose layout and colors as you see fit. You must, however, adhere to these requirements:
newD = squeeze(D);

plothandle = contourslice(newD,[], [], [slice1, slice2, slice3, slice4], 8);

view(3);

set(plothandle,'LineWidth',2);
First, the 128x128x1x27 matrix D
is squeezed into a 128x128x27 matrix newD. The single dimension of
the original D matrix that is typically used for color data is dropped
out. We'll use colormaps to include color in our plots.
Next, the built-in MATLAB function contourslice is called to show
the four slices slice1,slice2,slice3 and slice4 of the newD matrix.
The last argument to contourslice, 8, specifies the number of contour lines per plane.
The plot is shown using MATLAB's default 3D view, which is azimuth = -37.5 and
elevation = 30. Finally, the linewidth is set to be thicker so that the contour lines
are more easily seen.
In your mriGUI, you will read slice1, slice2, slice3 and slice4 from the listbox and then use the code above to display the slices simultaneously.
newD = squeeze(D);
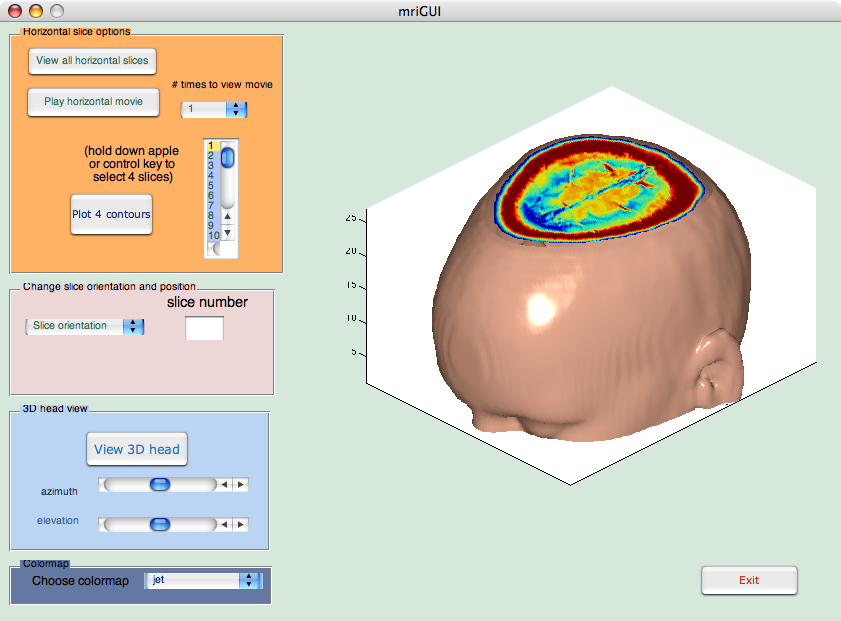
and then the data are smoothed with smooth3 and then isosurface calculates the isodata. Patch displays this data as a graphics object.
Ds = smooth3(newD);

hiso = patch(isosurface(Ds,5),...

         'FaceColor',[1, 0.75, 0.65],'EdgeColor','none');
To show a sliced-away top of the head, we use isocaps to calculate the data for another patch that is shown at the same isovalue (5) as the surface. We use the original unsmoothed (yet still squeezed) data D to see the details of the interior.
hcap = patch(isocaps(newD,5),...
   'FaceColor','interp','EdgeColor','none');
We do some fine-tuning by setting the view, aspect ratio and lighting:
daspect([1,1,0.4]);

 lightangle(45,30);

 lighting phong;

 isonormals(Ds, hiso);

 set(hcap,'AmbientStrength', 0.6);

 set(hiso,'SpecularColorReflectance',0,'SpecularExponent',50);
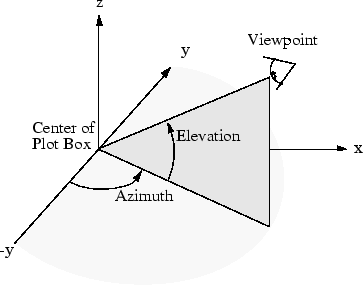
Here is an example of viewing an object from directly overhead:
az = 0;

el = 90;

view(az, el);
In MATLAB, when creating the azimuth and elevation
slider components, you can specify the min and max
values using the Property Inspector in GUIDE. A reasonable range might be [0,360] for azimuth and [-90,90]
for elevation. Then, your program can read the values from the
azimuth and elevation sliders and use those values to update your
view. This means that azimuth and elevation need to be
in the handles structure of your GUI program so that they can be accessed
by other components.
Notes:
panels and alignment useful in GUIDE.
mriGUI_OpeningFcn function to construct
the fields of the handles structure that stores all information that
is shared across GUI components.
loadinData.m from MATLAB's command
window to create the mri.mat file, then you include
load mri; in the mriGUI_OpeningFcn.
handles structure must include the following statement at the end:
guidata(hObject,handles)
disp function.
These values will be printed in the Command Window.
mriGUI.m and
mriGUI.fig files in the assign8_programs
folder that you submit electronically.