CS112: Lab 12 :: More fun with plotting
Here are a couple of useful things that MATLAB can do with 2D plots:
- filled polygons with text
- pie chart
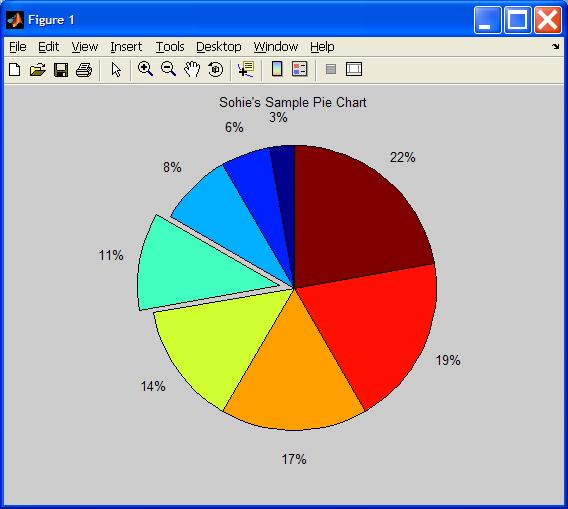
% pie chart code
a= [5 10 15 20 25 30 35 40];
pullout = [0 0 0 1 0 0 0 0 ];
pie(a,pullout); % pull out one of the slices
title('Sohie''s Sample Pie Chart');
- error bars

x = linspace(0,2,21);
% erf is a built-in special MATLAB function:
%  erf(x) = 2/sqrt(pi) * integral from 0 to x of exp(-t^2) dt.

y = erf(x);
e = rand(size(x))/10;

errorbar(x,y,e)
title ('Sample Error Bar plot');
- Other specialized 2D graphs (check out via MATLAB's help)
| area - Filled area plot
|
| bar - Bar graph
|
| barh - Horizontal bar graph
|
| bar3 - 3D bar graph
|
| comet - Comet-like trajectory
|
| ezplot - Easy to use function plotter
|
| feather - Feather plot
|
| fplot - Plot functions
|
| hist - Histograms
|
| pie3 - 3D pie chart
|
| plotmatrix - Scatter plot matrix
|
| ribbon - Draw 2D lines as ribbons in 3D
|
| stem - Discrete sequence or "stem" plot
|
| stairs - Stairstep plot
|
 What about 3D plots?
MATLAB handles 3D plots in much the same way as 2D plots.
For line plotting, use plot3 rather than plot,
as shown below.

t = 0:pi/50:5*pi;
plot3(sin(t),cos(t),t);
grid on;
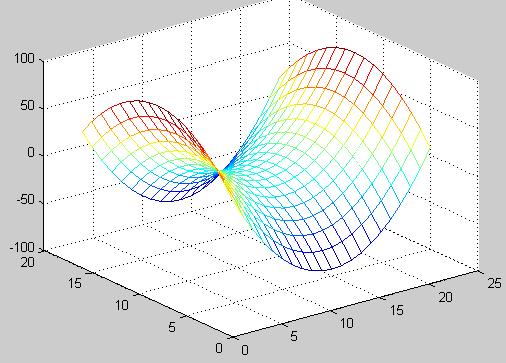
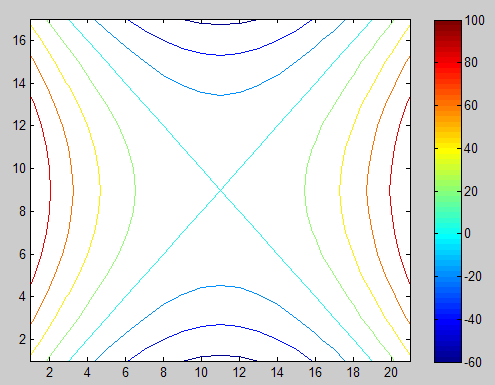
Sometimes it is useful to plot 3D surfaces.
Here is an example of a simple mathematical equation.
z = x2 - y2
How to plot this equation:
- Create two datapoint series. Say -10<=x<=10 and -8<=y<=8.
- Create two new vectors that contain the squares of the
x and
y vectors from Step 1.
- Use
meshgrid to create matrices of all the x squared and y squared values
in proper orientation.
The effect of meshgrid is to create a matrix X with the x-values along each row, and a matrix Y with the y-values along each column. This is done so that it is easy to evaluate a function z=f(x,y) of two variables on the rectangular grid. Click here for an example of how meshgrid works.
- Create the matrix Z in terms of X and Y (where Z(i,j) = X(i)^2 - Y(j)^2)
Here are some fun 3D plots:
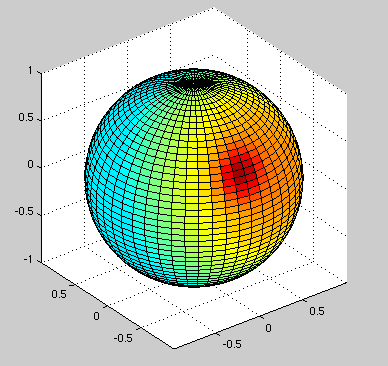
Source Code
Here is code for other fun 3D plots:
- Other specialized 3D graphs (check out via MATLAB's help)
| comet3 - 3D comet-like trajectories
|
| meshc - Combination mesh/contour plot
|
| meshz - 3D mesh with curtain
|
| stem3 - 3D stem plot
|
| quiver3 - 3D quiver plot
|
| slice - Volumetric slice plot
|
| surfc - Combination surf/contour plot
|
| trisurf - Triangular surface plot
|
| trimesh - Triangular mesh plot
|
| waterfall - Waterfall plot
|