|

|
| Source Code | Source Code |
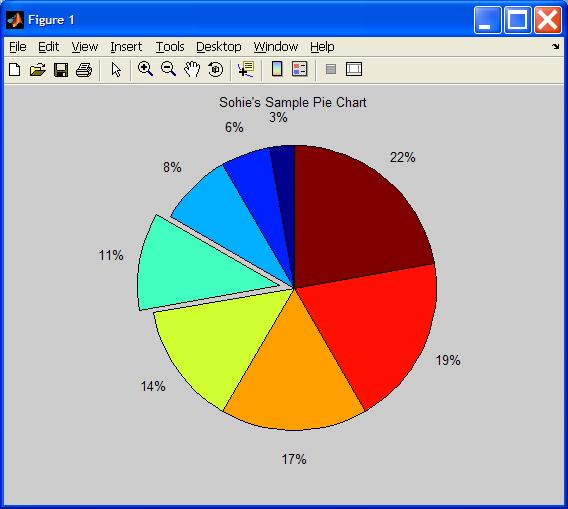
% pie chart code
a= [5 10 15 20 25 30 35 40];
pullout = [0 0 0 1 0 0 0 0 ];
pie(a,pullout); % pull out one of the slices
title('Sohie''s Sample Pie Chart');

x = linspace(0,2,21);
% erf is a built-in special MATLAB function:
%  erf(x) = 2/sqrt(pi) * integral from 0 to x of exp(-t^2) dt.

y = erf(x);
e = rand(size(x))/10;

errorbar(x,y,e)
title ('Sample Error Bar plot');
| area - Filled area plot |
| bar - Bar graph |
| barh - Horizontal bar graph |
| bar3 - 3D bar graph |
| comet - Comet-like trajectory |
| ezplot - Easy to use function plotter |
| feather - Feather plot |
| fplot - Plot functions |
| hist - Histograms |
| pie3 - 3D pie chart |
| plotmatrix - Scatter plot matrix |
| ribbon - Draw 2D lines as ribbons in 3D |
| stem - Discrete sequence or "stem" plot |
| stairs - Stairstep plot |