CS 240 Lab 6: C Programming & Pointers
Peter Mawhorter
How do Computers Work?
How do Computer Circuits Work?
- Power flows through chips in the computer, creating patterns of activation driven by a clock and determined by logic gates.
- Flip-flops allow information to be stored and then updated on a clock edge, allowing circuits to compute values that change every tick.
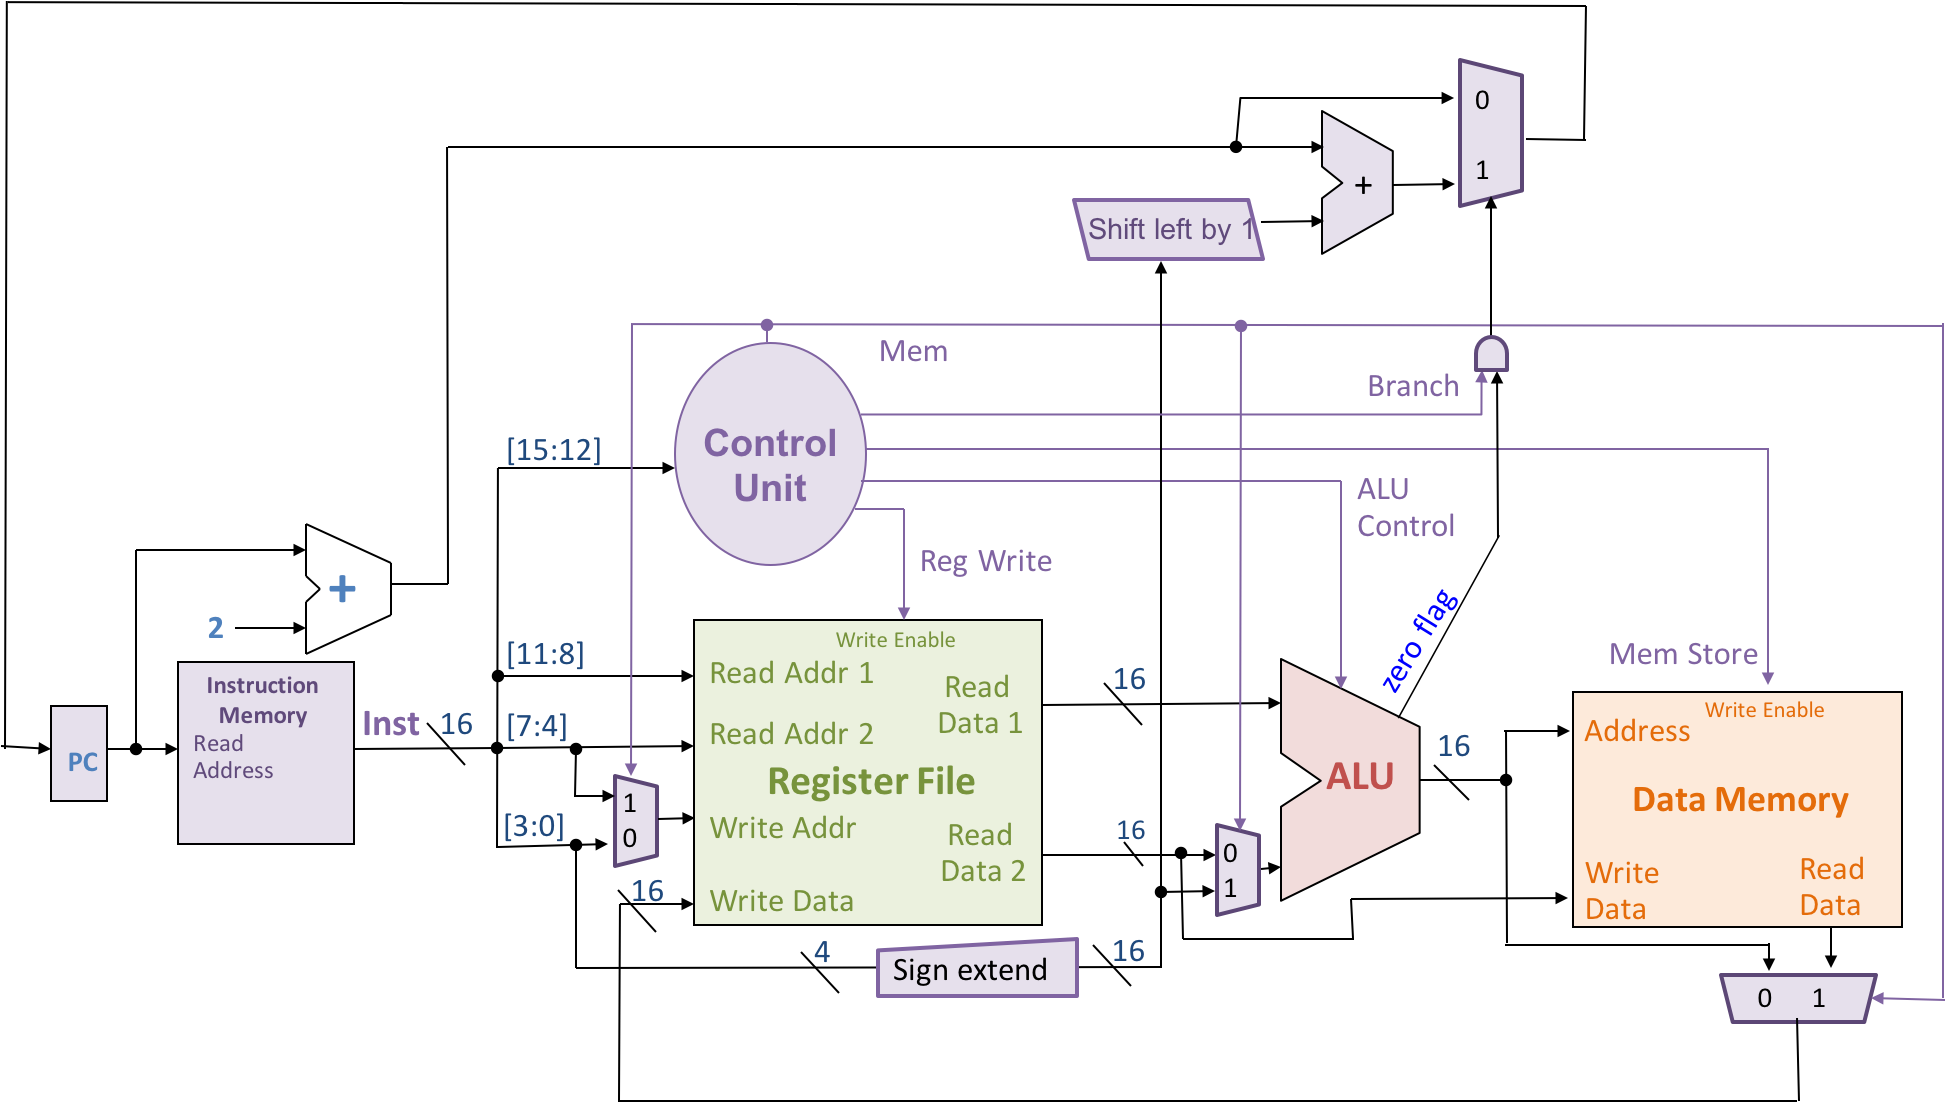
- An ALU performs basic operations, a register file stores operands & results, and RAM stores lots of data.
How do Computers Represent Things?
- High/low voltage patterns represent numbers in binary and/or
symbols.
- These are stored in arrays of flip-flops called registers.
- Random Access Memory provides bigger/slower storage.
- A long sequence of data in RAM can represent something like text.
- The computer performs basic operations with these numbers, like
addition, through the use of an Arithmetic Logic Unit.
- All other operations are built from a series of basic operations.
What Controls the ALU?
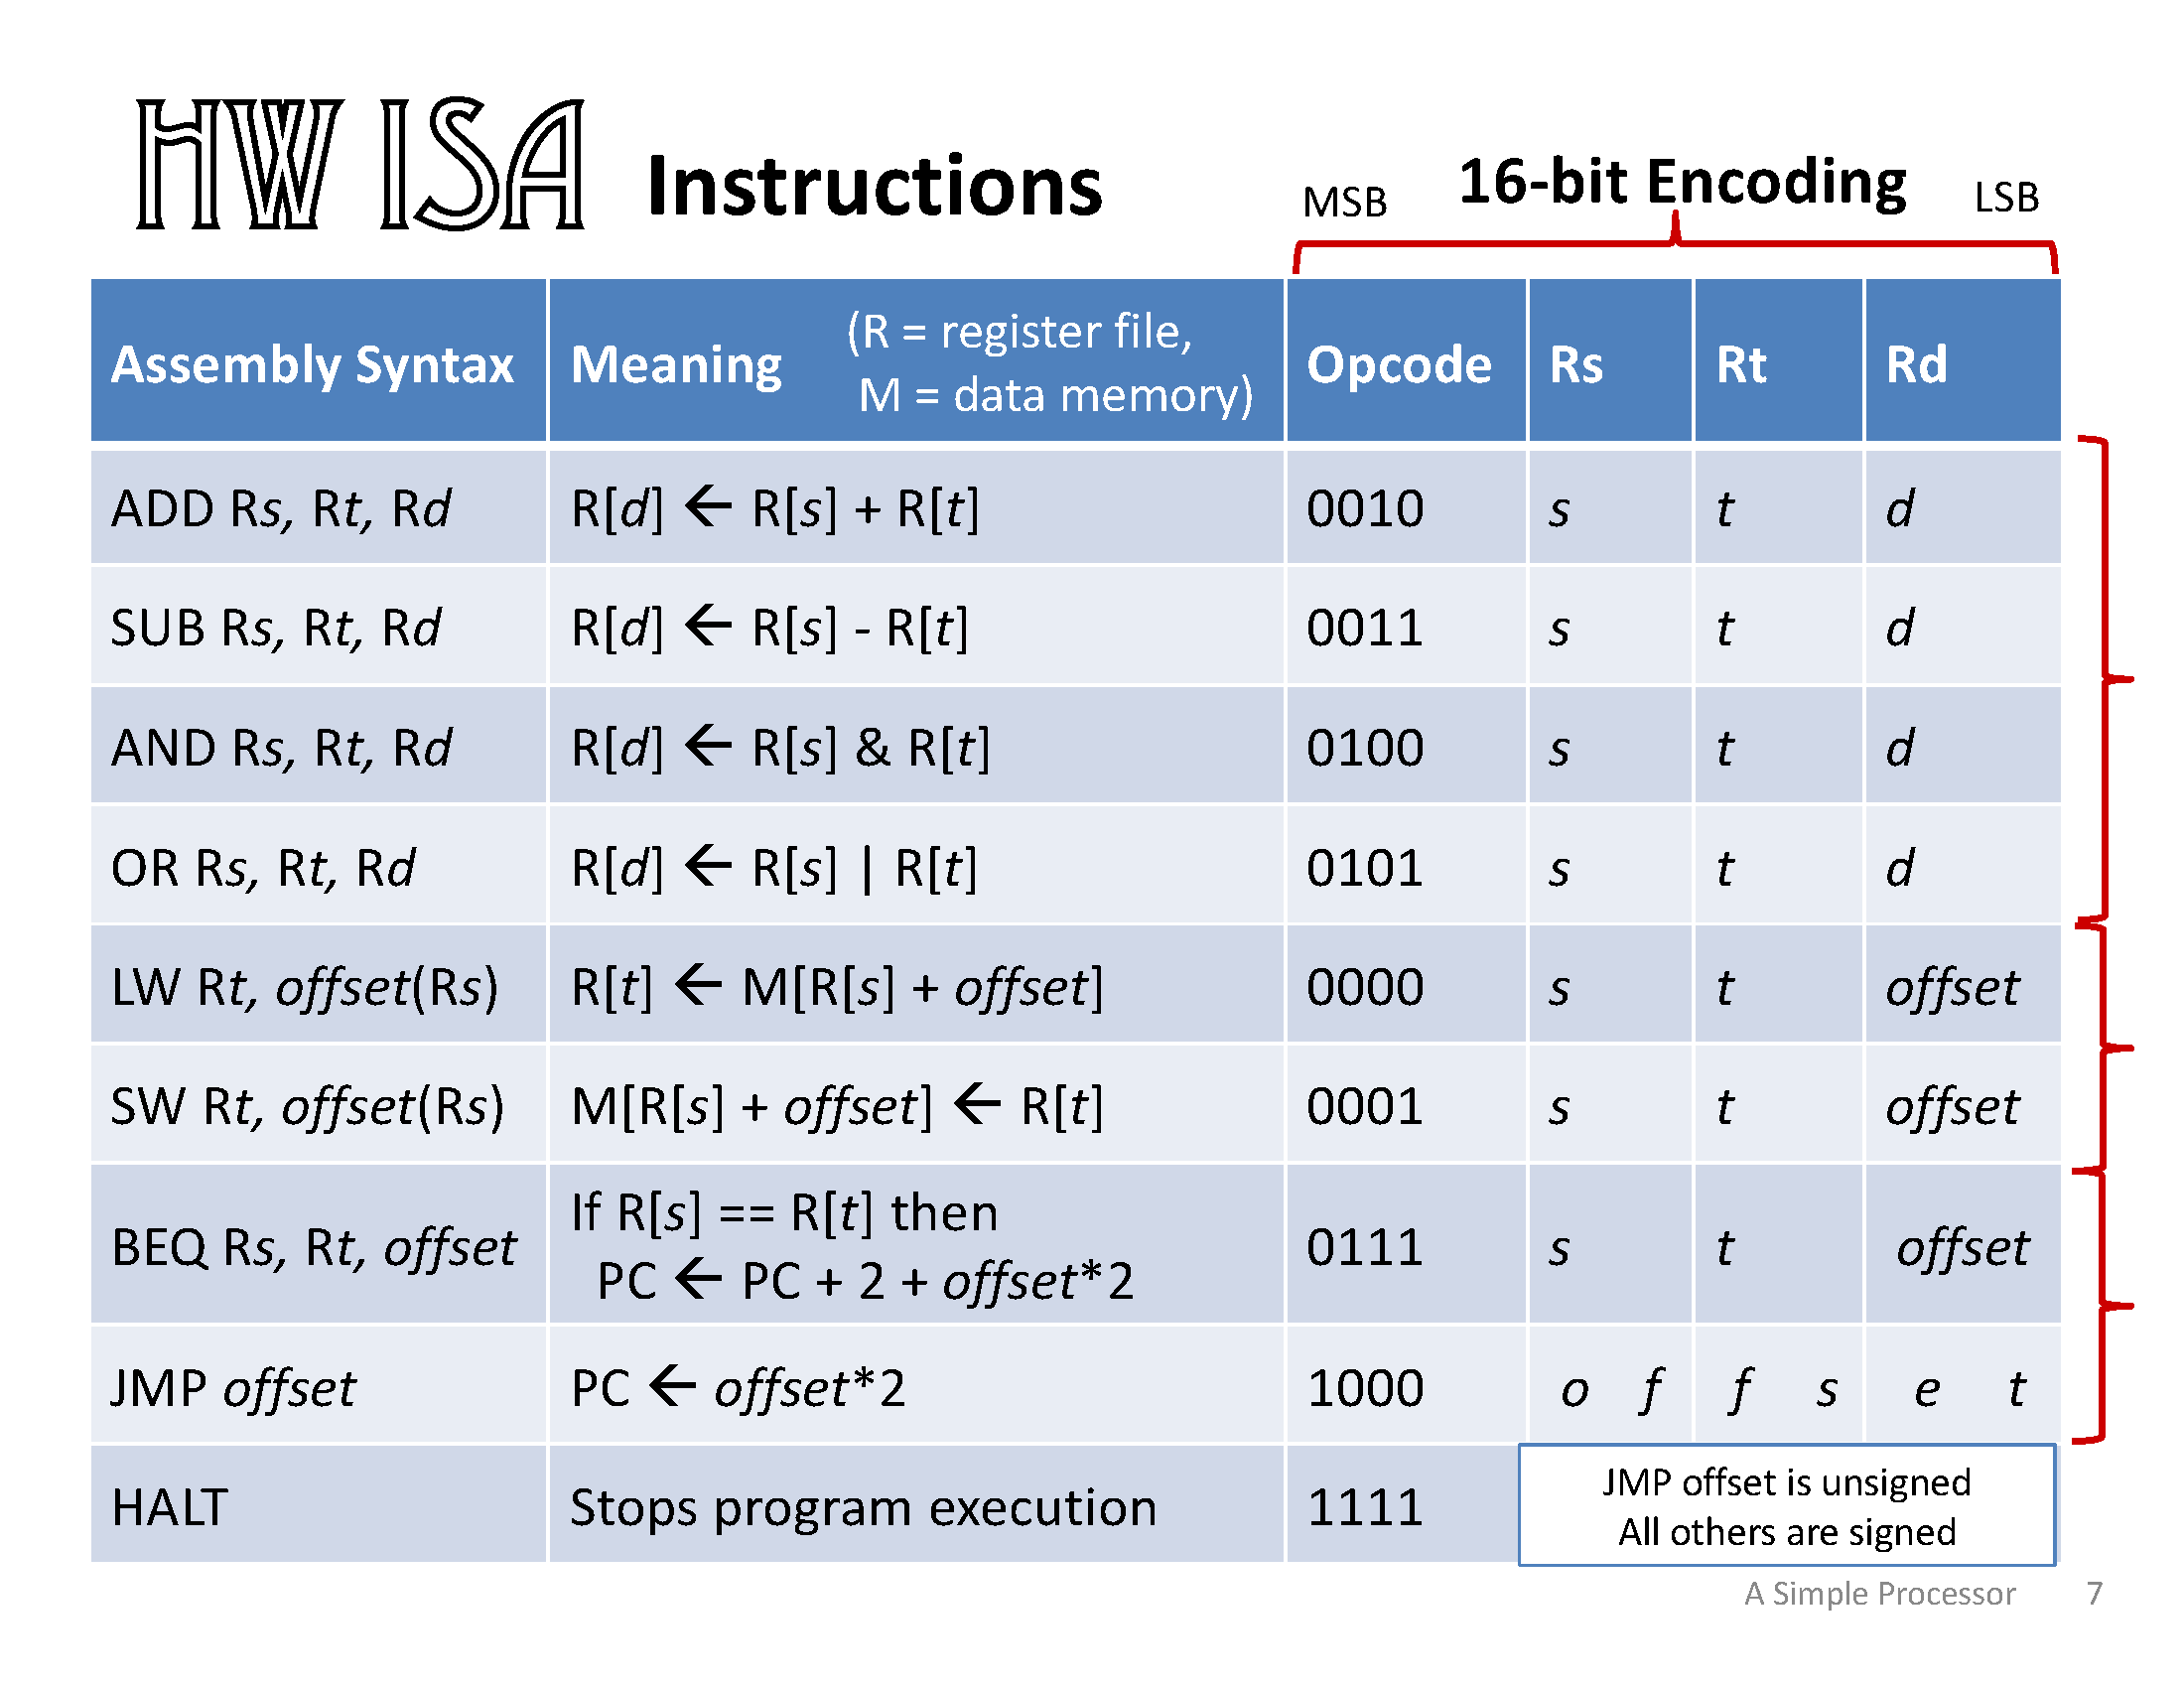
- Hardware instructions composed of an
Operation Code plus supporting data control what the
computer does on each tick.
- Hardware instructions are stored in program memory and we normally advance one instruction per tick.
- An instruction set specifies what hardware
instructions are available and what they do.
- Assembly language is a way of writing down machine instructions in a (just slightly) more human-readable format.
But what about?
- Where do machine instructions come from?
- How is code in a language like C translated into machine instructions?
Short answer: the compiler handles this for us.
Outline
- Questions (Arch assignment)
- Code ↔︎ Assembly
- Reminders
- Pointers (“arrays” and “strings”)
- Tools (
gdbandvalgrind) - Break
- GO
Write your questions on the boards.

Datapath Table
| Component | Inputs | Outputs |
|---|---|---|
| PC |
|
|
| Instruction Memory |
|
|
| Control Unit |
|
|
| Register File |
|
|
| Arithmetic Logic Unit (ALU) |
|
|
| Data Memory (RAM) |
|
|
| BEQ Logic |
|
|
Code ↔︎ Assembly
- Variable ≈ Register OR memory address
- Complier uses 3-step (load + operate + store) with variables stored in memory
- Function ≈ Chunk w/ jumps in & out
- Arguments → Placed on stack by caller
- Return location → Placed on stack by caller
- Local variables → Placed on stack if needed
- Newly created objects → Allocated on heap
- Dedicated register for current stack location
if/while/catch/etc. ≈ BEQ ± JMP
Reminders
#include <stdio.h> gets
you printf
Prints:
%creates a hole, letter specifies what kind
Pointers
DON’T BE FOOLED
IN C THERE ARE ONLY POINTERS

Pointers
- In an instruction, we use 4 bits can mean “which register,” OR
“which address,” OR “how far to offset?”
![The OR and LW lines from the HW ISA instructions slide, with a highlights on the second and last columns. In the second column, the “R[s]” part which is used as an operand for OR but as the base address to read from for LW is highlighted. In the last column the highlight shows that for OR, the “Rd” value is ‘d’ which indicates a register to store into, while for LW, the “Rd” value is instead an offset. In both cases an arrow points points between the two entries with a question mark beside it.]()
- Consider the instructions
5112 (OR R1, R1, R2) and
0121 (LW R2, 1(R1))…- The 1s mean different things.
Pointers
- A pointer is a variable which holds an address
- Use the
*operator to dereference it and talk about what’s at that address (can both read & write there) - Use the
&operator to get the address of something which can be stored in a pointer
- Use the
- A pointer’s type determines the size of things it points to
- Adding or subtracting from a pointer moves it that far (e.g., int =
4 bytes, so for
int *p,p + 1is 4 bytes farther) void *when we don’t know what we’re pointing to
(avoid this)
- Adding or subtracting from a pointer moves it that far (e.g., int =
4 bytes, so for
Pointers
- The C compiler understands normal values and pointers. Both arrays and strings are implemented using pointers.
int vec[]is really justint *vec- Strings have type
char *
Arrays?
Prints:
Arrays?
Declare a variable x of type “array-of-int”
Actually: type int *, or
pointer-to-int
Put the numbers 1, 2, 3 into that array
Actually: allocate space for three numbers as part of
the program, and store the address of the first one in
x
Arrays?
Prints (%p is the format for a pointer):
This is the memory address of the first number
Arrays?
Prints:
??? Addresses change each time you run it, for security
Arrays?
Prints:
*(x + 1) ??? Add 1 to address of x, get value there
Arrays?
- Array
int x[]is really a pointerint *x- Empty
[]means unspecified size. - Just points to the first element.
- Can add to it to get a farther pointer.
- Empty
- Expression
x[2]is really just*(x + 2) - What if we need to create a new array?
- Use
mallocto ask for some bytes
- Use
malloc
- Stands for “Memory ALLOCate”
- Puts your stuff on the “heap”
- Allocates a specific number of bytes
- Use
sizeofto figure out # of bytes based on # of entries of a specific type - You need to free them later, or you get a memory leak
- Result is
void *, we cast to what we need
(cast using(type) value)
- Use
Strings?
- Does C support strings?
- Ha ha ha no.
- But I can write
char *string = "Some words."?
char *string
char *
Strings?
- Strings are just pointers to characters.
- Points to first character.
- Up to your code to read the rest.
- Strings include “NUL byte” =
0x00at end.- Except when you mess up and they don’t :(
Strings?
Strings
- There are functions for dealing with strings in
string.h
(don’t use them for this lab) - Support for Unicode is pretty DIY :(
- Lots of “sharp edges” particularly around user input
Arrays? Strings?

Arrays? Strings?

Tools
gdbandvalgrindgdbstands for “Gnu DeBugger”valgrindafter the gates of Valhalla (“grinned,” not “grind”)
gdb
- Use
gdbto debug a C program compiled with -g:- Pause and go step-by-step
- Set breakpoints to stop at & continue
- Print out variable values
- Modify values on the fly
valgrind
- Use
valgrind‘memcheck’ mode to check for memory errors during execution:- Prints messages when invalid memory is written or read
- Gives summary of leaked memory at end of program
More Info
- Tools page has references:
![The OR and LW lines from the HW ISA instructions slide, with a highlights on the second and last columns. In the second column, the “R[s]” part which is used as an operand for OR but as the base address to read from for LW is highlighted. In the last column the highlight shows that for OR, the “Rd” value is ‘d’ which indicates a register to store into, while for LW, the “Rd” value is instead an offset. In both cases an arrow points points between the two entries with a question mark beside it.](direct-vs-indirect-instruction-bits.png)