CS307: Bezier Curves
Plan
- Bezier curves & blending functions
- Bezier curves in Three.js
- Exercises: Heart, ribbon, and double ribbons
- Thought exercises: Coke bottle & circle
Bezier Curves & Blending Functions
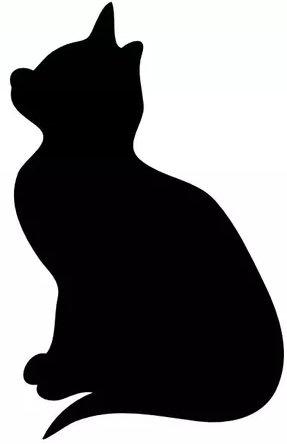
In computer graphics, we often need to model objects whose shape is defined by free-form curves:
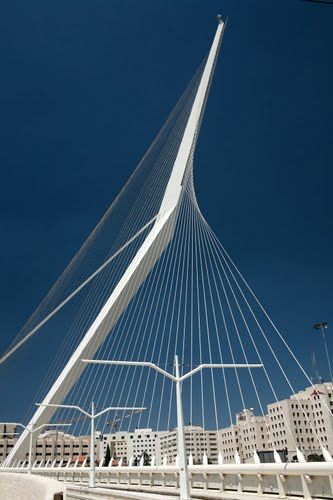
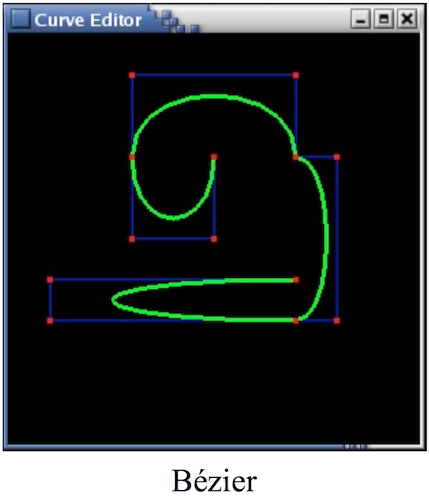

One of the most popular approaches to modelling such shapes uses Bezier curves — let's first explore the basic ideas with this online tool.
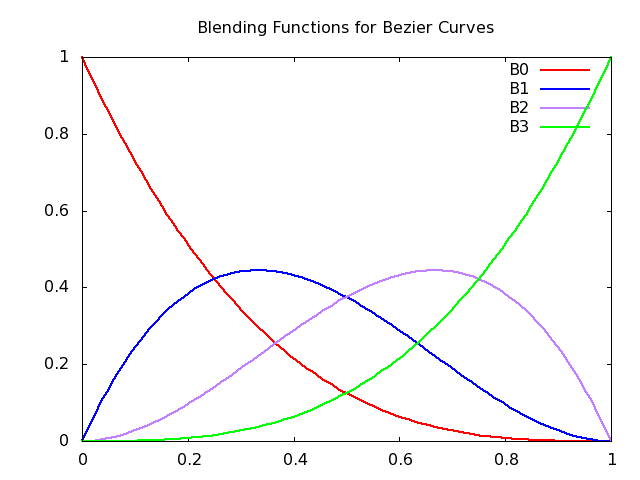
We will represent a parametric curve P(t) as a weighted sum of four control points, P0, P1, P2, P3: \begin{eqnarray*} P(t) &=& B_0(t)*P_0 + B_1(t)*P_1 + B_2(t)*P_2 + B_3(t)*P_3 \end{eqnarray*}
For each value of t, the weights are given by four blending functions B0(t), B1(t), B2(t), B3(t).
This figure from the reading shows the four blending functions for cubic Bezier curves:
The equations for these functions, which are from the family of Bernstein polynomials, are shown in this plot in WolframAlpha:
plot (1-t)^3,3t(1-t)^2,3t^2(1-t),t^3 from t=0 to 1: all of them in one plot
Observations:
- The first and last blending functions are monotonic
- The functions are always non-negative
- The functions sum to one
- The second and third functions peak at 1/3 and 2/3
The Bezier curve is always within the convex hull of the control points.
Bezier Curves in Three.js
We'll start with this demo of an S curve:
The code for this demo is quite short:
var controlPoints = [ [0,0,0],
                      [2,2,0],
                      [-2,1,0],
                      [0,3,0] ];
var curveGeom = TW.createBezierCurve(controlPoints,20);
var curveMat = new THREE.LineBasicMaterial( { color: 0xff,
                                              linewidth: 3 } );
var curve = new THREE.Line( curveGeom, curveMat );
scene.add(curve);

function showCP (cpList) {
    for( var i = 0; i < cpList.length; i++ ) {
        scene.add( TW.createPoint(cpList[i]) );
    }
};

showCP(controlPoints);          // optional, for debugging
This code depends on two functions in TW, which just make our lives a little easier. The first
is TW.createBezierCurve():
The above function creates a THREE.CubicBezierCurve3.
The second function, TW.createPoint(), is just a minor convenience:
To understand the role of the control points, let's play with the curve using a GUI:
(You can also play with this online Bezier curve demo, which allows you to drag the control points with your mouse and view their coordinates. To map your results onto the above Three.js demo, place the control points within a box whose X and Y coordinates range from -5 to +5.)
- What is the result of moving P1 farther from or nearer to P0 without changing the direction?
- How is the
convex hull
related to the curve? - How many bends can you get in the curves?
- How tight a loop can you get? Can you get this?
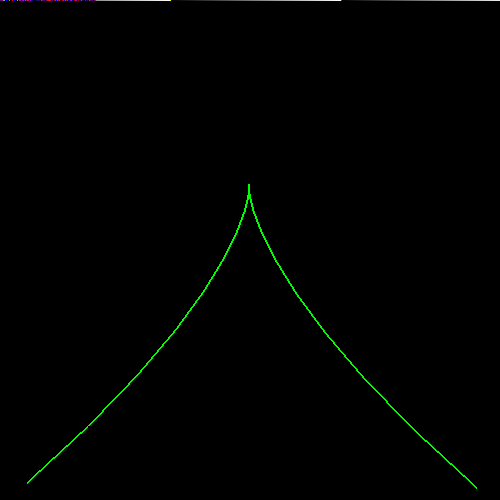
The following demo illustrates a 3D Bezier curve:
Exercises: Creating 2D Shapes from Bezier Curves
For each of the following exercises, use this S curve code file as a starting point to create the desired shape.
Heart
Devise the control points to draw a heart, like this:
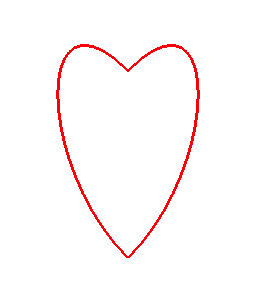
Implement the result, using this
S curve as a starting point.
Hint: This requires two Bezier curves.
The result might look like this: heart curve
Here are two solutions with control points shown as spheres:
heart2.html
heart3.html
Ribbon
Devise the control points to draw a ribbon, like this:
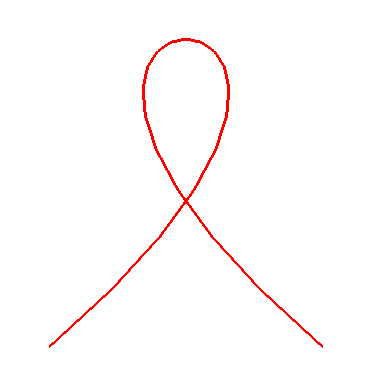
Implement the result, using this S curve as a starting point.
The result might look like this: ribbon curve
Double Ribbons
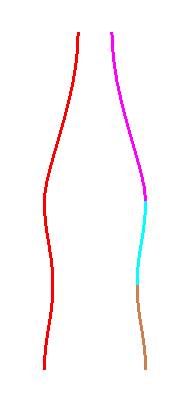
Devise the sets of control points to draw a joined double ribbon, like this:
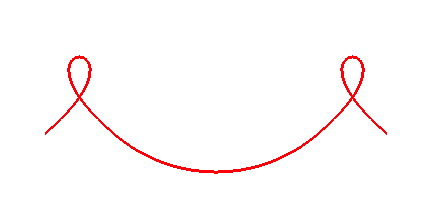
Implement the result, using this S curve as a starting point. How many Bezier curves do you need in this case?
The result might look like this: double ribbon curve
Coke Bottle
Here's a thought experiment: How would you draw the silhouette of a Coketm bottle?
Circles
Can you do a circle? How or why not?