Lab 1
|
|
CS 332
Lab 1 |
|
The purpose of this lab is to learn how to work in the MATLAB environment, learn how to read and display images in MATLAB, and explore a few of our visual abilities that we will study in this class.
On your MAC, double-click on the Macintosh HD icon in the upper right corner
of the screen, then open the Applications folder, and finally, double-click on
the MATLAB_R2008b icon to start MATLAB. Instructions for starting MATLAB
on public PCs and the CS department Linux machines can be found in the
Introduction to MATLAB document.
The default MATLAB desktop contains 4 inner windows:
Like other windows-based applications, you can move windows, change their size, move the
borders between the inner windows, use scroll bars to navigate up and down the window contents,
etc. If your MATLAB windows change their appearance in an undesirable way, you can restore the
original setup by selecting Desktop Layout>Default from the
Desktop menu at the top of the main window.
MATLAB is interactive - the user enters commands in the Command Window, MATLAB executes
these commands, and the results are returned and printed. Enter some commands in the Command
Window (the % symbol precedes comments that you do not need to enter):
num = 10
% create a variable "num" assigned


% to the value 10


values = [1 2 3 4 5]

% create a 1D array (vector) of 5 numbers
num

% print the value of an existing variable
format compact

% omit vertical spaces in future printout

a = 2
clc

% clear the Command Window
b = 20.0;

% a semi-colon at the end of a statement


% suppresses printout of the value
whos

% list the variables currently defined


% in the MATLAB workspace
c = (2 * 3) + num

% perform simple calculations
num = sqrt(c^3 + b^2)
val2 = [3 8 -4; -1 0 2]

% create a 2x3 matrix of numbers
size(val2)

% get the dimensions of the matrix
You can also observe the variables listed in the Workspace window.
Execute a previous command again by double-clicking on the command in the Command History window, or by copying-and-pasting the command into the Command Window and hitting the carriage return.
Use the four arrow keys to do the following:
Once a command is complete, it can be executed by hitting the carriage return, regardless of the position of the cursor in the line.
Use fetch to connect to your personal directory on the CS file server, and
then navigate to the /home/cs332/download directory. To do this, first click
on the fetch (dog) icon at the bottom of the screen. In the dialog box that
appears, enter cs in the Hostname: box, enter your username and
password and click on the Connect button. The contents of your directory will
then appear. Click on the path icon in the upper left corner of the
fetch window, and select / in the pull-down menu (the root directory).
To navigate downwards, double-click on the home folder, then
cs332, and finally the download folder. Drag the lab1
folder to your desktop. In MATLAB, select the Current Directory window and
click on the << icon near the left end of the menu bar below the Current
Directory label. Select your username from the pull-down menu. Then double-click the
Desktop folder, and finally the lab1 folder. The lab1
folder contains some code files and an image file (with the .jpg extension).
MATLAB has a built-in editor for creating and viewing code files and text files. There are two ways to open an initial editor window:
edit in the Command Window
New>M-File from the File menu in the
upper left corner of the main MATLAB window
MATLAB code files are referred to as M-Files and have a .m file extension.
In this lab, we'll create an M-file called a script, which contains
a sequence of MATLAB commands that can be executed all at once. Executing a script produces the
same results that would be obtained if the individual commands were entered, one-by-one, in the
Command Window.
In the editor, type some assignment statements, similar to those entered earlier in the Command Window. Save the script in one of the following two ways:
Save from the File menu
A dialog box will appear where you can enter the name of the script file - enter the
full file name (e.g. lab1.m) in the text box labeled with Save As:,
and then click on the Save button. The file will be stored in the current directory
(your lab1 folder) - check its listing in the
Current Directory window. Now execute the script in the Command Window by entering the first file
name lab1, and note the printout of the variable names and values.
Enter whos to see that
your script variables now exist in the MATLAB workspace.
Edit the script (for example, add semi-colons at the end of each statement), save the modified file, and execute it again in the Command Window. As a shortcut, you can save the file by clicking on the floppy disk icon at the top of the editor window.
An existing M-File can be opened in the MATLAB editor by (1) selecting Open... from
the File menu and navigating to the desired code file, (2) double-clicking on the file
name in the Current Directory window, or (3) invoking the edit command in the Command
Window:
edit lab1
The file (lab1.m in this case) must be stored in the
Current Directory, or exist somewhere on MATLAB's search path.
Use the imread function to load an image into MATLAB, and give it a name:
coins = imread('coins.png');
          % note the semi-colon!
(The coins.png image comes with the MATLAB system.) The image is now stored in a
2D matrix named coins - you can check its size by entering the whos
command or checking the list of variables in the Workspace window. There are two
ways to display an image. Use imshow for quick viewing:
imshow(coins)
The image will appear in a separate figure window. Closer examination of the image
is possible with imtool:
imtool(coins)
Two windows will appear, an Image Tool window and a smaller Overview window. Try the following:
(X,Y)
coordinates of the image location and the intensity value stored at this
location (an integer in the range from 0 to 255)
Examine the changes in image intensity between adjacent image locations, around the borders of the coins and along the edges of the raised figures on the surface of the coins. Also note that even in regions that appear to have constant intensity, such as the dark background, the intensities do not have a constant value. Our first step in analyzing images will be to detect and describe the changes in image intensity - this information provides the first hint about the structure of the scene being viewed.
Close all of the open windows by executing the following two commands in the Command Window:
close all


imtool close all
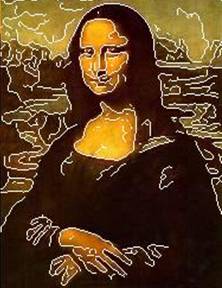
The presence of sharp intensity changes strongly influences our perception of the image that
appears on our retina. To view a demonstrate of this, execute the makeCornsweet script
and view the cornsweet image that is created:
makeCornsweet;


imtool(cornsweet)
Consider the brightness of the image in a corner region and in the center of the circle. Does the brighness appear the same in these two regions? Use the Pixel Region Tool to examine the image intensity in these two areas - is it the same or different? Create a graph of the intensity values along a horizontal strip through the center of the image:
plot(cornsweet(100,:));

% plot the values along row 100
At the edges of the circle, there are slow changes of intensity surrounding a sudden, sharp drop of intensity. Our visual system is very sensitive to this sharp change, causing us to mis-perceive the brightness of the central circle.
Although we do not always perceive them correctly, smooth variations of intensity can
convey the 3D shape of an object surface. Load and view the spheres image in
the lab1 directory:
spheres = imread('spheres.jpg');


imshow(spheres)
What do you perceive? Do all of the circular regions of smooth shading look the same?
The pattern of intensity in all of these regions is actually the same - some are just
upside-down relative to the others. In fact, we can change the perceived shape of a region
just by turning it upside down. Use the imrotate function to rotate
the entire image upside down, and then view the rotated image in a new figure window:
newImage = imrotate(spheres, 180);

% create a new image


% that is rotated 180 degrees

figure


% open a new figure window

imshow(newImage)
Move the windows so that you can view both simultaneously. Locate the same circular regions in both images. Does their 3D shape look the same? If not, do you have any idea why? We will study how image shading can be used to compute the 3D shape of an object - to perform this computation, we need to make assumptions about how the visual world typically behaves. One of those assumptions plays a key role in the perception of this image!
Our left and right eyes have slightly different perspectives on the world that we use to perceive the 3D structure of objects. This process is refered to as binocular stereo. You can demonstrate this phenomenon with your fingers. Hold both fingers in front of your eyes, with one finger in front of the other. Focus on your left finger and close one eye and then the other. The right finger will appear in a different place in the left and right views. Try this with your right finger placed in front or behind your left finger (keeping your eyes focused on the left finger) and notice how the position of the right finger changes. This shift in position is used to infer the relative depth of the two fingers. To make this inference, the visual system must locate a finger in the left eye's image, locate the same finger in the right eye's image, and then measure the shift in position to determine the 3D distance to the finger in space. This may seem like an easy task, but consider a more challenging demonstration of binocular stereo, by creating and displaying a random-dot stereogram:
makeStereo;

% create left and right stereo images

subplot(1,2,1), imshow(left)

% view images side-by-side

subplot(1,2,2), imshow(right)

figure, imshow(anaglyph)

% view a color anaglyph


   % created from the left and right images
If you view the color anaglyph with red-blue glasses (red on the left and blue on the right), your left eye sees only the left stereo image and your right eye sees only the right stereo image. There is no clue to the 3D structure of the scene available in the individual left and right images, but the patterns of dots are shifted between the two images in a way that mimics the projection of a 3D surface onto the two eyes. You can enlarge the color anaglyph by dragging the lower left corner of the figure window. What is the 3D structure of this surface? To determine this surface, the visual system must determine which dots in the left image match with which dots in the right image - does this still seem like an easy task? We'll learn about ways to solve this stereo correspondence problem.
Close all of your open windows and clear all of the current variables in the MATLAB workspace:
close all


clear all
When objects in the world move relative to the observer, or the observer moves relative to the world, features move in the retinal image. Analyzing image motion allows us to track moving objects with our eyes, locate the boundaries of objects, and infer the 3D structure of the world. Performing this analysis is also a complex task that requires us to make assumptions about how the world typically behaves under motion, and we do not always perceive motion correctly. Consider a spiral contour that is rotating around its center point:
makeSpiralMovie;

% create a movie of a rotating spiral

movie(spiralMovie, 10, 15)

% display the movie 10 times,


   % at a rate of 15 frames per second
How does the motion of the spiral appear? Imagine a particular point along the spiral contour. When the spiral rotates around its center, what path should this point follow? Do you think we perceive the motion of this point correctly?
The relative motion between image features can also be used to infer 3D shape. This can be demonstrated with the following movie:
makeCylinder;

% create a movie of a rotating cylinder

movie(cylMovie, 3, 20)

% display the movie 3 times,


   % at a rate of 20 frames per second
Similar to the stereo demonstration, there is no clue about the 3D shape of the moving object from each static frame - in this case, only the relative movement of the dots conveys the 3D cylinder shape. We will explore ways to compute the 3D shape of an object from the motion of the object viewed in the image.
For a fun demonstration of our ability to perceive 3-D structure and movement from a simple image of moving dots, go to the following website:
http://www.biomotionlab.ca/
and double-click the BMLwalker link. Enjoy!
When you are done, quit out of MATLAB by selecting Exit MATLAB from the
File menu.