Deep Learning and Biased AI
Peter Mawhorter
October 5th, 2020
Bias in AI
Readings
- Image “upscaling” algorithm with racial bias.
- Twitter cropping algorithm exhibits bias as well.
- (optional) Excavating AI on bias in ImageNet and other AI systems.
Group Discussion:
What are the sources of bias in AI systems?
What kinds of bias appear in these systems?
Group Discussion:
Who is responsible for harm done by an AI system?
Group Discussion:
If you were a movie villain, how would you use ostensibly harmless/helpful AI to do evil?
Bias
- AI both amplifies and disguises bias.
- Machines are wrongly seen as unbiased.
- In fact, they thrive on biased data.
- Theory-free AI is especially prone to bias.
Data Science
- Normally, a model is based on a theory.
- Data confirms or complicates the model.
- Theory is revised to produce a new model.
“Data science” sometimes skips a step and creates a model directly from data.
Theory-free Models
- A theory-free model doesn’t teach us anything.
- We can’t critique the theory behind it.
- It might still “work” very well.
Models and Authority
- Scientific models can be components of oppressive systems.
- Provide “justifications” for racism, colonialism, etc.
- Put more power in the hands of the powerful.
- “Science” sounds authoritative.
- It’s easy to focus on whether a model or theory works, without ever asking about what effect it will have.
Regression
Regression
- Normal math: solve an equation.
- Regression: match an equation to data.

Regression
If we have data points , our error is:
We can find an analytical minimum if our
function is simple, like .
Gradient Descent
- What if is too complicated to solve the error equation?
- We can try to find a minimum using Newton’s method as long as it’s differentiable.
- Basic idea:
- Take the derivative of our error function with respect to the constants in that function, .
- Nudge those constants in the direction that reduces the error.
- Repeat until we get to zero error (or a minimum).


Overfitting
- Regression is only meaningful if the function is suitable.
- A complex enough function can fit any data.
- Only a theory can give you confidence to interpolate or extrapolate.

Deep Learning
Videos
- Video: Deep Learning Basics including Autoencoders (14:55 to 33:40)
- Extra Video: What is a Neural Network?
- Extra Video: How Neural Networks Learn?
Core Concept
- Create a really general function.
- Fit it to whatever data you have.
- Use the fitted function.
Training
- Gradient is hard to compute for 1000s of data points.
- Just compute gradient for a few data points at a time, and repeat this process over and over again.
- Use a small learning rate to move slowly.
- Problems include overfitting as well as local minima of the error function.
A Neural Network
Network Structure
- Matrix of weights multiplied by input vector.
- Apply an activation function to each output.
- Simulates neurons in the brain: several signals are combined with different connection strengths to trigger an output.
- Weights control connection strengths; activation function determines result.
Sigmoid

Deep Networks
- A deep network has multiple layers.
- Input from one layer is fed into another layer.
- Size of output is usually smaller each time.
- Millions to billions of parameters (weights).
- Let a computer calculate the derivative…
Example Target Function
| Input () | Output () | Input () | Output () | |

|
[1, 0] |

|
[0, 1] |
What does it learn?
- Under the right conditions, it learns what humans do: how to find edges, and then patterns of edges, etc.
- The right conditions are tricky to produce.
What does it need?
- A huge amount of data
- Minimum hundreds images; millions for high quality
- Labeled data, so that we can compute error values
- All sources of labeled training data are biased 🙁
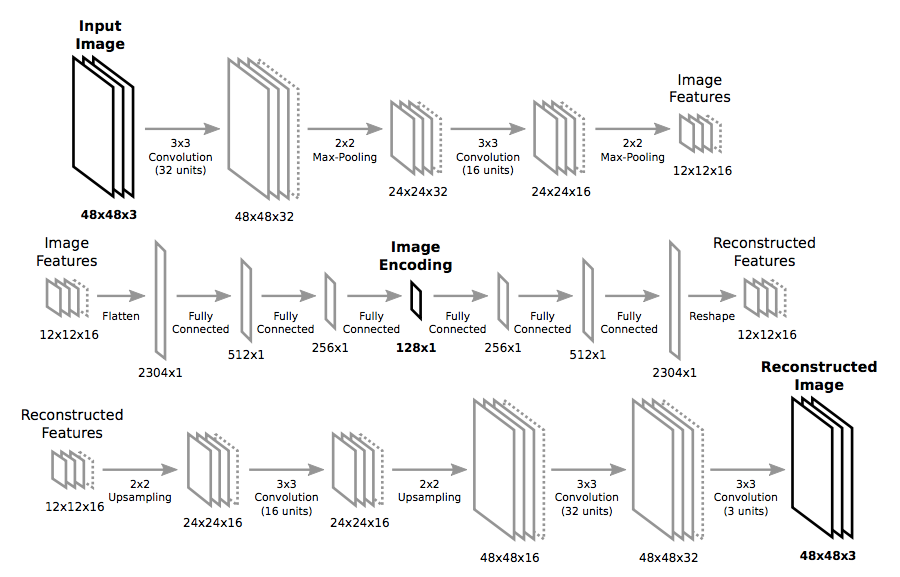
Autoencoding
- Set and ask network to learn the identity function
- Network has to learn compression, because its internal state is smaller than the original image.
- Learn the basics from unlabeled data
- Unlabeled data is much easier to come by
- All sources of unlabeled training data are also biased 🙁
Applications
Applications
Discussion
How might biases affect these applications of deep learning?
- Image captions
- Deep fakes
- Generating art
- Face recognition
- Image super-resolution
- Crime prediction
How should we feel about deep learning and AI as a scientific project?
My Work
Computational Creativity
- Can computers be creative?
- What does it mean to be “creative?”
- Could computers support human creativity?
Critical (Computational) Creativity
- Critique-by-reply.
- Building generators to deeply understand systems.
- A mix of computer science and media studies.
- Focus on interactive media, especially video games.
Past Projects
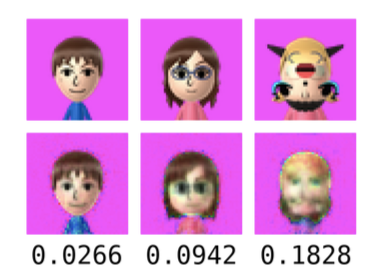
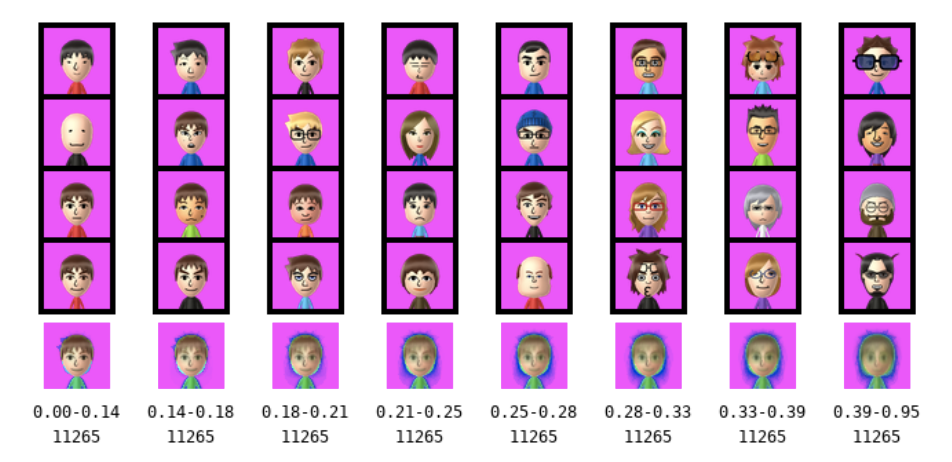
Measuring “novelty” using an auto-encoder network.
Bonus
Convolutional Networks
- Like the eye, apply the same neural structure in parallel to many pixels.
- Output is a smaller field of pattern vectors.
- Combine pattern vectors using pooling to reduce processing requirements.
Recurrent Networks
- Remember information across multiple activations using a “memory” input in addition to the usual input.
- Output a new “memory” vector in addition to usual output.
- Useful for processing or generating sequences with variable length, like text.