
CS112: Final Project, Spring 2020
Overview
Over the last three weeks of the semester, you'll have the opportunity to work on a programming project that's tailored to your interests. This program will be implemented as an interactive App, with a graphical user interface created with MATLAB's App Designer. Some ideas for possible projects are listed later in this document. You can also design your own project, but in this case, you should communicate early with Ellen and Stella, to help plan a project that's feasible to complete in the remaining weeks of the semester. You are welcome to work with a partner, but this is not required. There are three phases of the project, with work that you submit:
- Project Plan: due Tuesday, April 28
- Progress Report (Partial Code): due Tuesday, May 5
- Final Project and Zoom Meeting (with Ellen and Stella): due Friday, May 15
Some sample projects from past years are displayed on the Project Gallery page, but keep in mind that many of these projects may be more substantial than what is possible to complete in a 2-3 week time frame.
Your final program should consist of code that is developed by you (and your partner) from scratch. Unless you are given explicit permission from Ellen or Stella, it is not acceptable to use code from other sources, such as books, the Internet, or previous semesters of CS112. Use of code from these other sources without permission would be a violation of the Honor Code.
Project Phase One: Project Plan
Due: Tuesday, April 28
For this first phase, you should submit a description of your planned project (in English). The description should include the following:
- A summary of the application that your program will implement.
- A summary of background information for your application. For example, if you plan to implement a model or simulation, provide a summary of the model or process. If you plan to use data or other background information, briefly describe the data or information, and the source of this material.
- A sketch of the GUI for your planned application. This can be a hand-drawn sketch that's photographed with a cell phone or camera, or a screenshot of an initial GUI layout created with App Designer or some other online drawing tool.
- A list of the functions that you expect to define for your program,
with a brief description of the main tasks to be performed by each function.
This list should include any callback functions that need to be written for
specific GUI components, as well as any additional functions that may be defined
outside your
.mlappfile (similar to the separate functions that were provided for the projectile-launching application that you completed for Assignment 6). Note that as you proceed with your program development, you may discover additional functions that would be useful to define for your application.
If you are unsure of what to include in your project plan, please ask Ellen or Stella.
Phase One Submission Details: Write up your ideas in a
Google doc, including any pictures, and share the document with Ellen and Stella.
Please allow "Edit" permission when sharing, so that we can write comments directly
in the document. Use the following naming convention for your Google doc:
name_phase1. Also write your name in the document itself. If you are
working with a partner, include both names in the file name and document.
Project Phase Two: Progress Report (Partial Code)
Due: Tuesday, May 5
For the second phase of the project, you should submit a detailed skeleton
of the entire program, with some completed code. The amount of completed code
should be at least half of the anticipated final size of the program (Ellen
and Stella can help you figure out what this means for your program). Even if
the code is buggy, you should submit anything that you have written, so that
we can provide as much feedback as possible. In your skeleton, every function
definition (including callback functions and additional functions defined
outside the .mlapp code file) should have
comments indicating its purpose, and separate functions should have all of the
input and output variables specified and described. If you made decisions that
deviate from your initial Phase One Project Plan, add a brief explanation
of your decisions in comments in your code file(s).
Phase Two Submission Details: Place all of your code
and data files inside a single folder, and use the following naming convention
for the folder: name_phase2. Upload this folder into the
cs112/drop folder in your account on the file server. If you
are working with a partner, include both names in the folder name and upload
the folder to both accounts.
Project Phase Three: Final Program and Zoom Meeting
Due: Friday, May 15
For this last phase of the project, you should submit your final completed program. Your final program should encompass principles of good program design, such as effective use of functions to implement parts of the application, informative names for variables and functions, and code that is well organized and concise. For documentation, you should provide comments at the beginning of each function that describe what it does, and occasional comments throughout extended functions (in-line comments).
Create an electronic file called README.txt with
instructions on how to run the program. If parts of your program do not work, or
are not working as originally planned, provide additional notes about this in
the README.txt file.
Place all of your project files (all code and data files needed to run your
program, and your README.txt file) in a single folder, and use the
following naming convention for the folder: name_final. Upload this
folder into the cs112/drop folder in your account on the file server.
If you are working with a partner, include the names of both partners in the folder
name and upload the folder to both accounts. Be sure to verify with Ellen
or Stella that your electronic submission is complete after dropping it off.
Finally, we'd like to meet with you online to see a demonstration of your final program and chat about your project experience. A "sign-up sheet" will be created for scheduling a time for a Zoom meeting during reading period or finals week.
Project Ideas
In the rest of this document, we briefly describe three general kinds of project that you might consider, and two specific projects. Additional background that may be useful for these projects is provided in a separate document on MATLAB Extras. Many of the topics described in the MATLAB Extras document are related to the creation of Apps. Given the limited time available to complete this project, it's important to focus your efforts on the programming aspects of the project, rather than spending lots of time gathering data or other resources like images or audio files.
Project: Quizzing the User's Knowledge
Several projects in the gallery incorporated a quiz of some sort, on topics ranging from musical composers and instruments, to introductory neuroscience, spoken languages, art history, and Harry Potter. Many of these quizzes integrated textual and visual elements, and embodied creative ways of conveying the outcomes to the user. Methods for posing questions and soliciting answers were implemented with a variety of GUI components such as radio buttons, push buttons, and lists, and some built in multiple levels of difficulty. This project involves implementing a quiz in some area of knowledge of interest to you. The text for questions and answers should be stored in an external text file in a convenient format. There are many topics described on the MATLAB Extras page that are relevant to this project, such as the App startup function, Text Areas, adding buttons to a radio button group, and changing the text in GUI components.
Project: Data Visualization and Analysis
This project focuses on the analysis and visualization of data. This could
incorporate data that you have from some other research or course project (such as
in the project gallery examples of visualizing data from studies of wetlands
geomorphology, biological species in coastal waters, eye tracking behavior,
and neural responses). This project could also use data from online sources
(e.g. government websites or sites like
Kaggle.com) or from print resources
such as an almanac or encyclopedia. Your program should go beyond the simple
plotting of data that you did in early assignments (e.g. energy sources and the
animation of rising data). In the project gallery, for example, the project on
economic data visualization by Lily Zhou '11 involved an animated vizualization
that encoded a variety of economic indicators in multiple dimensions of the data
(e.g. the color, size, and position of data points), and incorporated both visual
and textual descriptions of the data. MATLAB can read data files in a variety of
formats, such as Excel spreadsheets and comma separated values (with a
.csv file name extension), in addition to basic .txt files.
(See tips on working with Excel spreadsheets on the MATLAB
Extras page.)
Project: Model Simulation
This third general type of project involves the simulation of a model of some sort. The project gallery includes examples of simulating physical models of relativity and oscillating springs, and economic models such as the Cournot and Stackelberg models of industry competition and the Ricardian trade model. Through courses or independent study, you may be familiar with models used in other disciplines. For this project, you should select a model that embodies multiple parameters that the user can explore through a GUI, and has behavior or outcomes that can be visualized in an interesting way. Your program can also be designed as a learning tool, providing both textual and visual explanations of how the model works and how to interpret the simulation results.
Project: Recognizing Languages
The frequency of occurrence of different letters of the alphabet varies across languages and can be used to identify the language in which a particular selection of text is written. The following tables show some data on the frequency of occurrence (listed as percentages, on a scale from 0 to 100) of the nine most common letters in six languages:
| English | German | Finnish | French | Italian | Spanish | ||||||||||||||||||||||||||||||||||||||||||||||||||||||||||||||||||||||||||||||||||||||||||||||||||||||||||||
|
|
|
|
|
|
This project involves completing a program that uses the above data to identify
the language in which a sentence is written. The download/languages
folder contains two .txt files for this project:
frequencyInfo.txt contains the above frequency information for the six
languages, and sentences.txt contains a sample sentence from each of
the six languages. Your program should allow the user to select one of the sample
sentences or enter their own sentence in
one of these languages. The visual appearance of the GUI can be embellished with an
image that's representative of a country with the computed language.
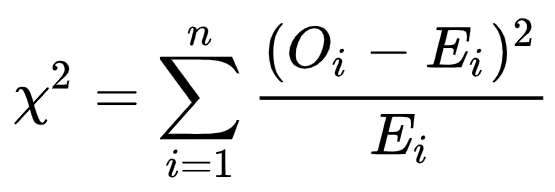
Tip: For each language, the expected frequencies of occurrence of its most common letters (Ei in the formula below) can be compared to the actual frequencies of occurrence of these letters observed in a sample sentence (Oi below), to determine how well the observed frequencies match the expected pattern, in order to identify the language with the best match. The difference between the two frequency distributions can be computed using the Χ2 (Chi-Squared) statistic shown here:
Project: Visualizing MRI Data
MATLAB has a built-in dataset of MRI images of the human brain. The image below on the left shows a montage of the 27 horizontal MRI slices in this data:
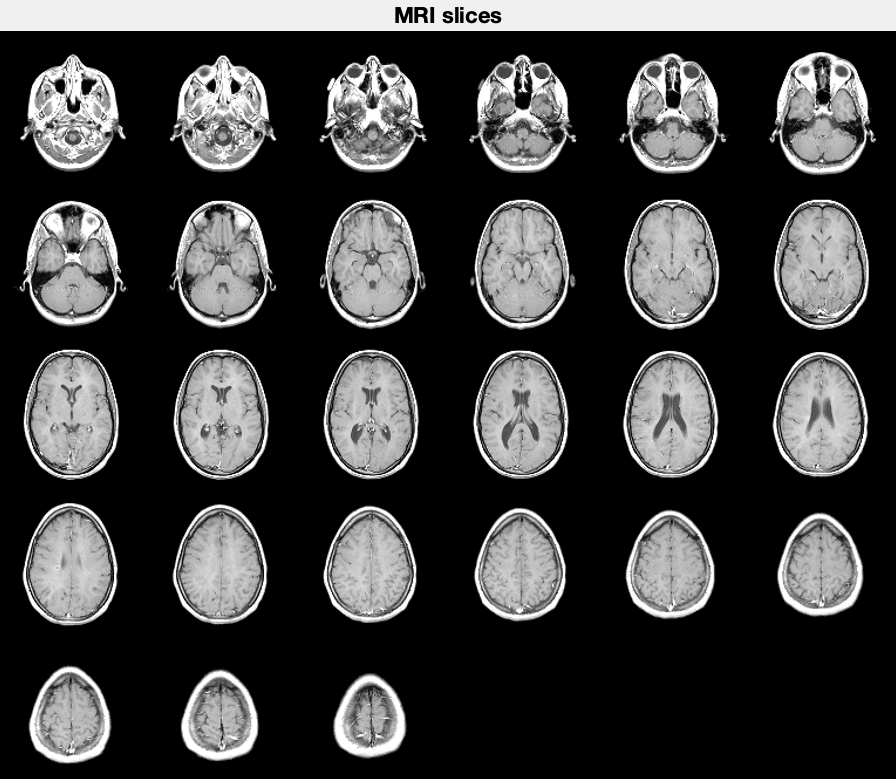
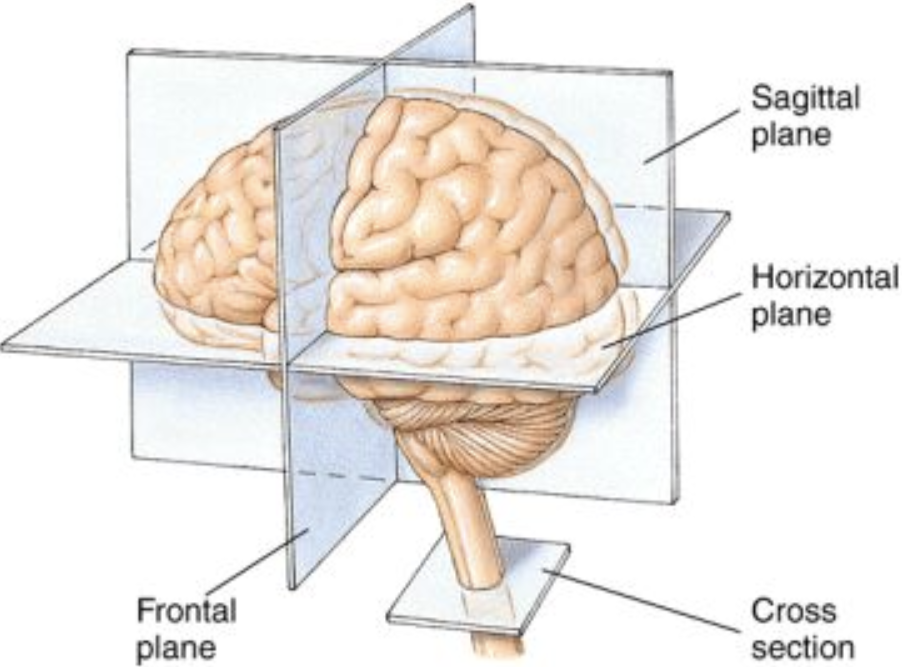
This project enables the user to view the MRI data in different ways. For example, the user might select a single horizontal, sagittal, or coronal (frontal) slice of the data to view (see the definition of these planes in the diagram above), zoom in to view a region of one of the slices in more detail, or view a set of slices as a montage or animation. Also consider how textual information might be incorporated into this application.
The MRI data can be loaded into the MATLAB workspace with the following command:
load mri
This file contains three variables named D, map, and
siz. The variable D is a four-dimensional matrix of size
128x128x1x27 that contains the MRI data. D can be
converted to a 3D matrix of size 128x128x27 with the squeeze
function that removes dimensions of size 1:
D = squeeze(D);
You can think of this 3D matrix as a stack of 27 horizontal MRI slices, each of
size 128x128. The variable map is a 89x3
colormap for displaying the MRI slices.
Tips: Two functions that may be handy for displaying sagittal and coronal
slices constructed from
the 3D matrix of MRI data are imresize and imrotate. There
is a built-in montage function in MATLAB that can be used in Apps, with
the Axes component specified with the Parent property, similar
to imshow (see the MATLAB Extras page).