CS112: Gallery of Final Projects
Picture puzzle (select an image of your choosing)
SeoHee Lim '19
How well do you know composers?
Liah Watt '19 and Ellie Erb '20
Note: turn up volume to hear music clips
Towers of Hanoi
Hannah Anderson '22
Guess the language game
Monique Montoute '18 and Karen Moorthi '18
Note: Make sure your volume is turned up to hear the audio language clips.
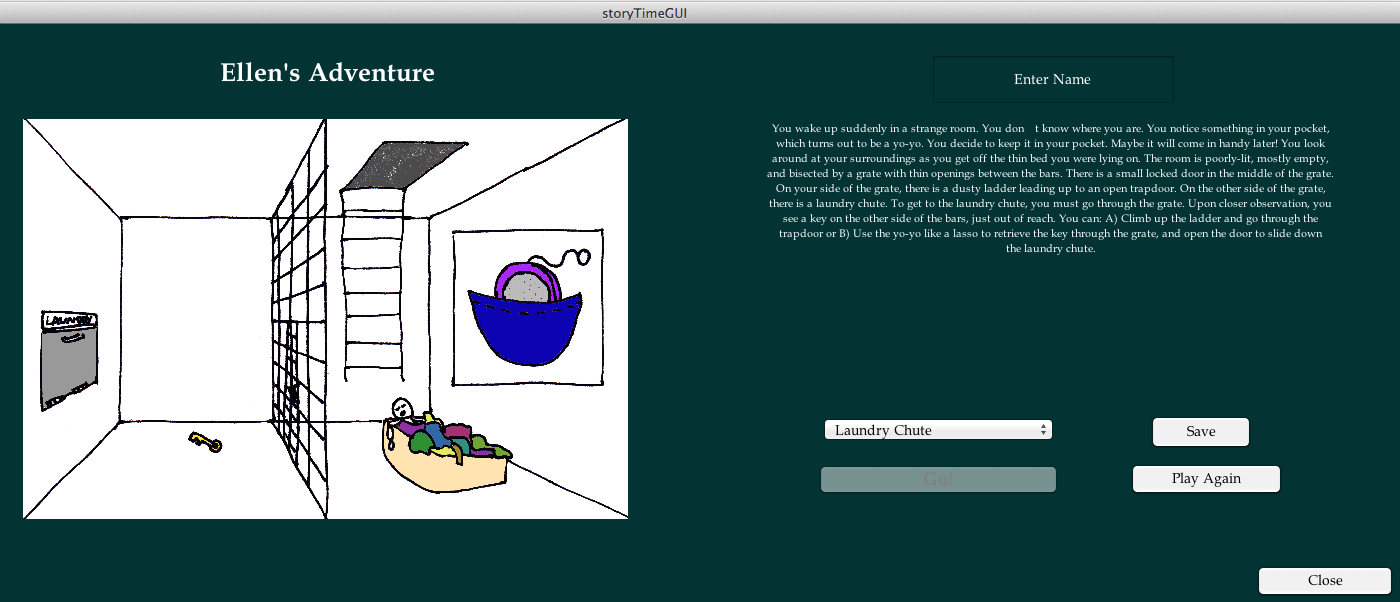
Harry Potter: Sorting Hat + Adventure game
Marie Zhang '21 and Fiona Ng '18
Note: This project had two different parts: 1) a sorting hat quiz (partially shown) and 2) a choose-your-own-adventure story (starts around 0:20).
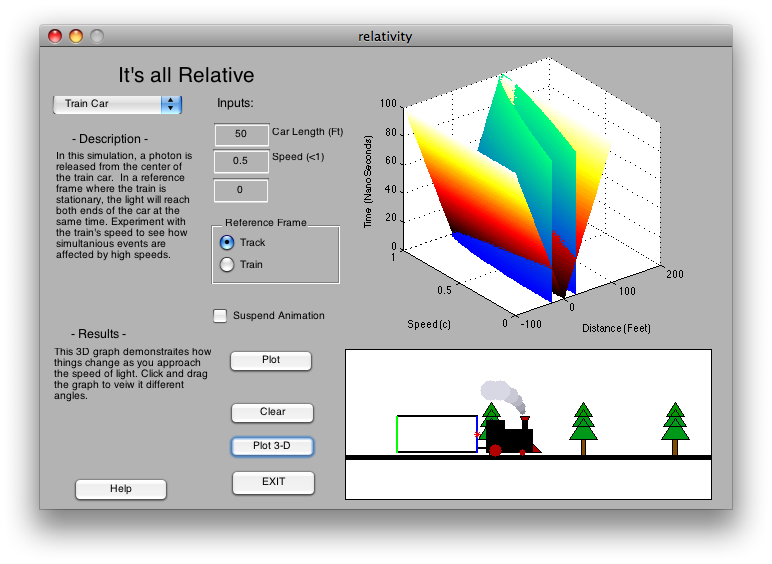
Relativity
Lynn Geiger '13
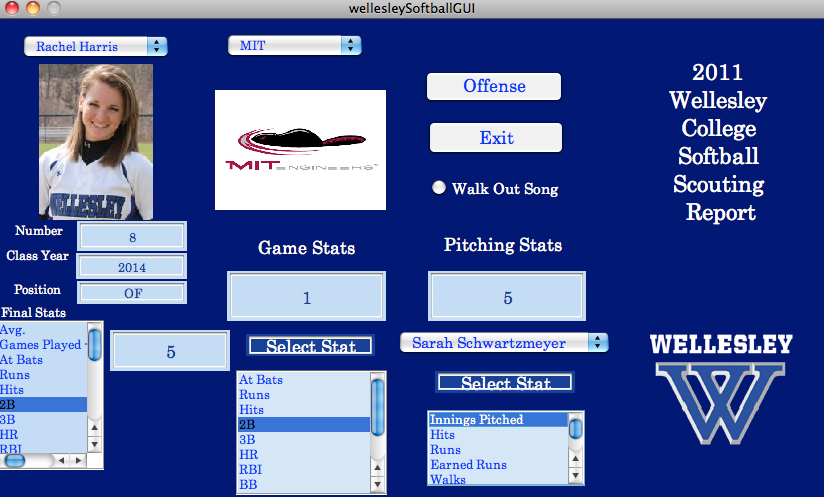
Wellesley Softball Scouting Report
Rachel Harris '14
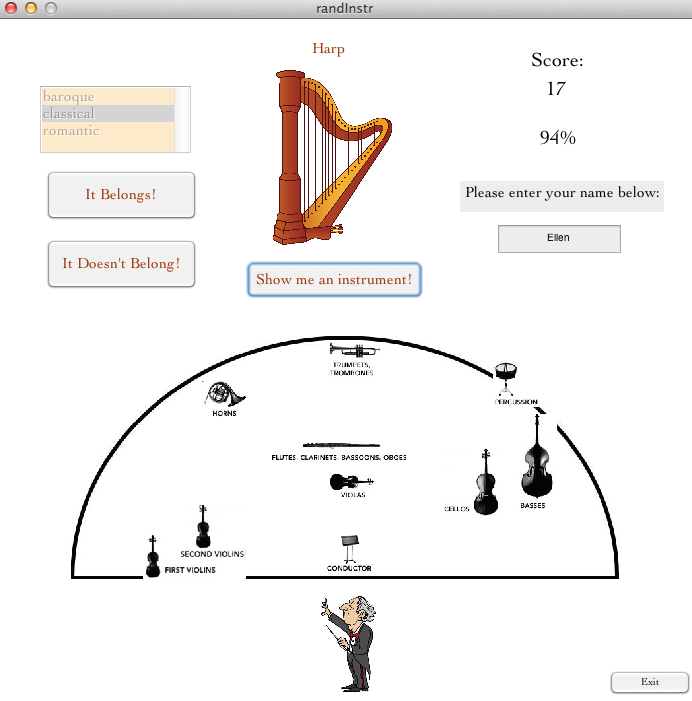
Learning about Orchestras
Ashley Funk '16 and Maymay Liu '15
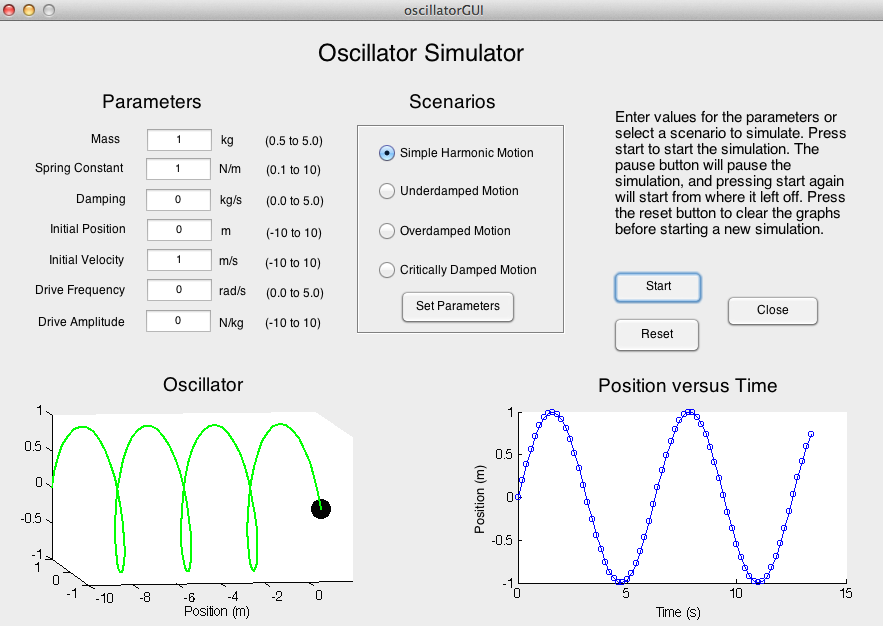
Oscillations
Carina Belvin '16 and Catherine Ho '16
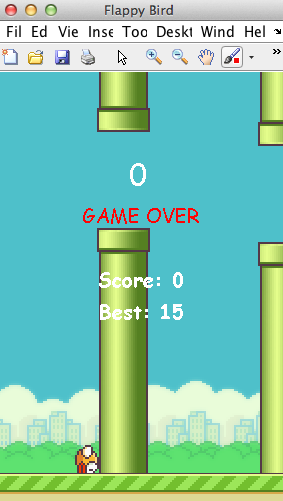
Flappy Birds
Juliette Chevallier '14
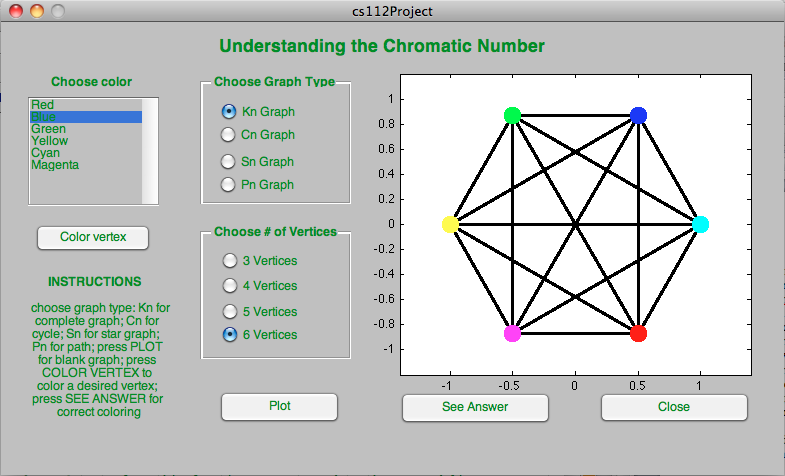
Chromatic Number
YuShan Dai '13
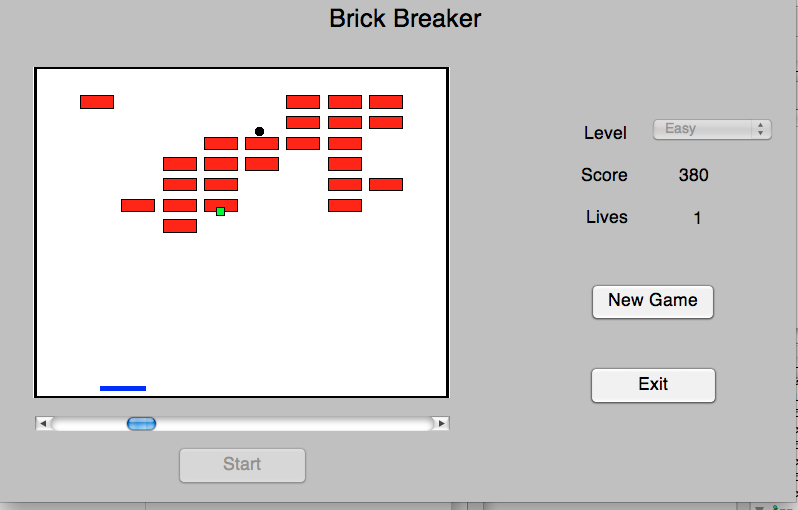
Brick Breaker
Nritya Kamath '13
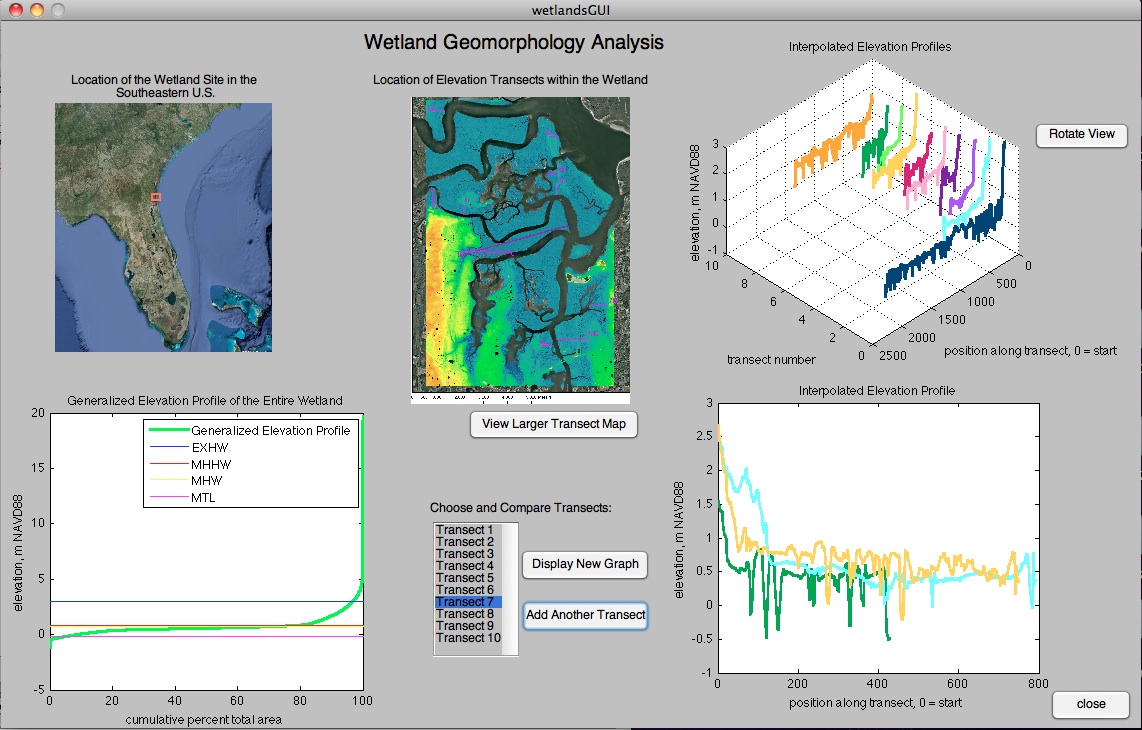
Wetlands
Jen Errington '11
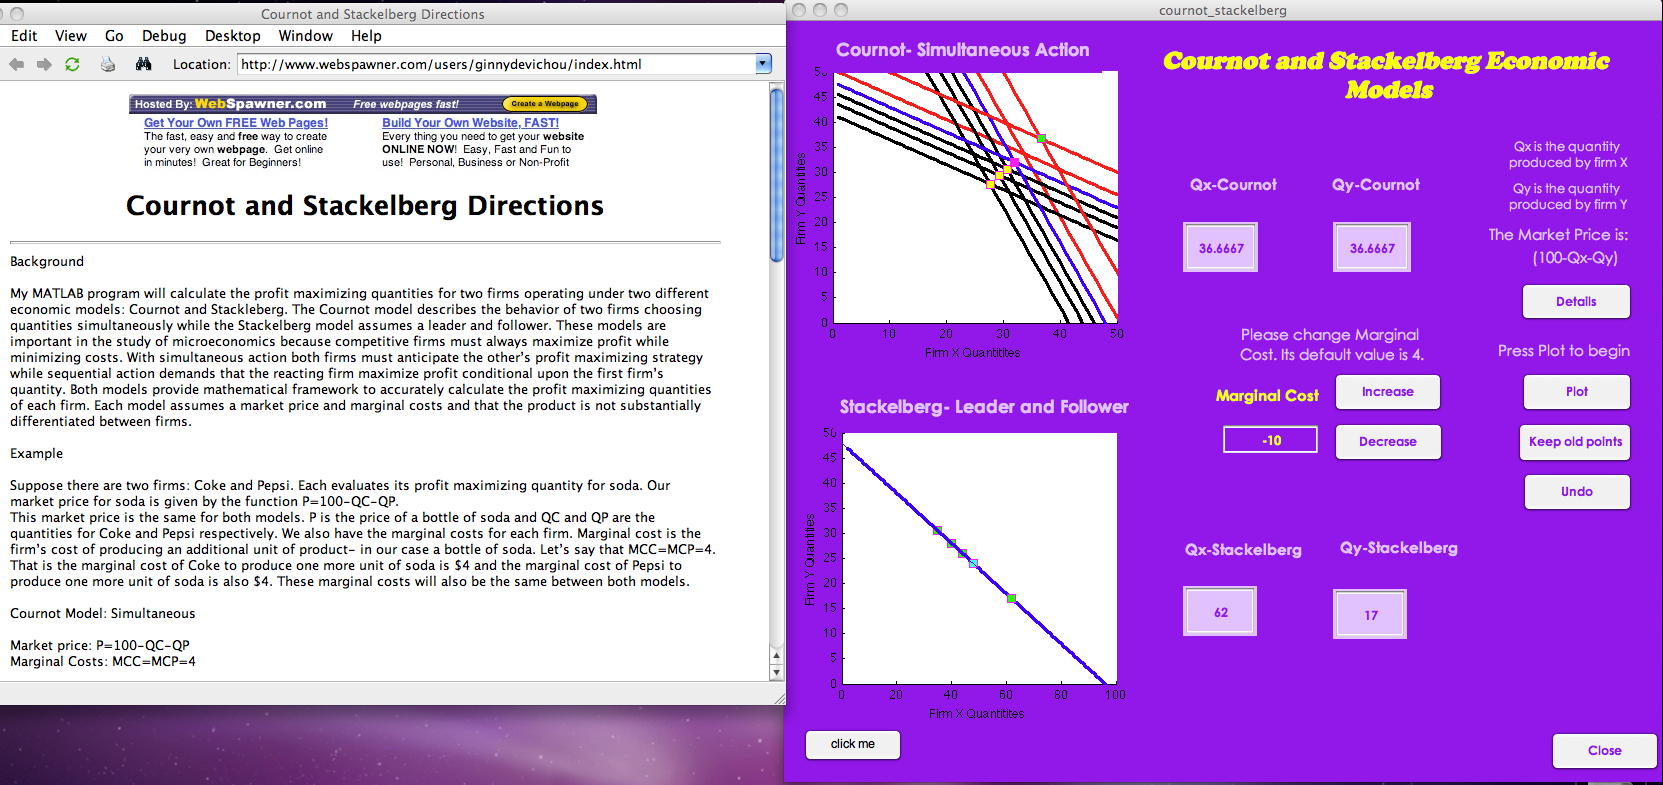
Cournot & Stackelberg Economic Models
Yasmine Devi-Chou '12
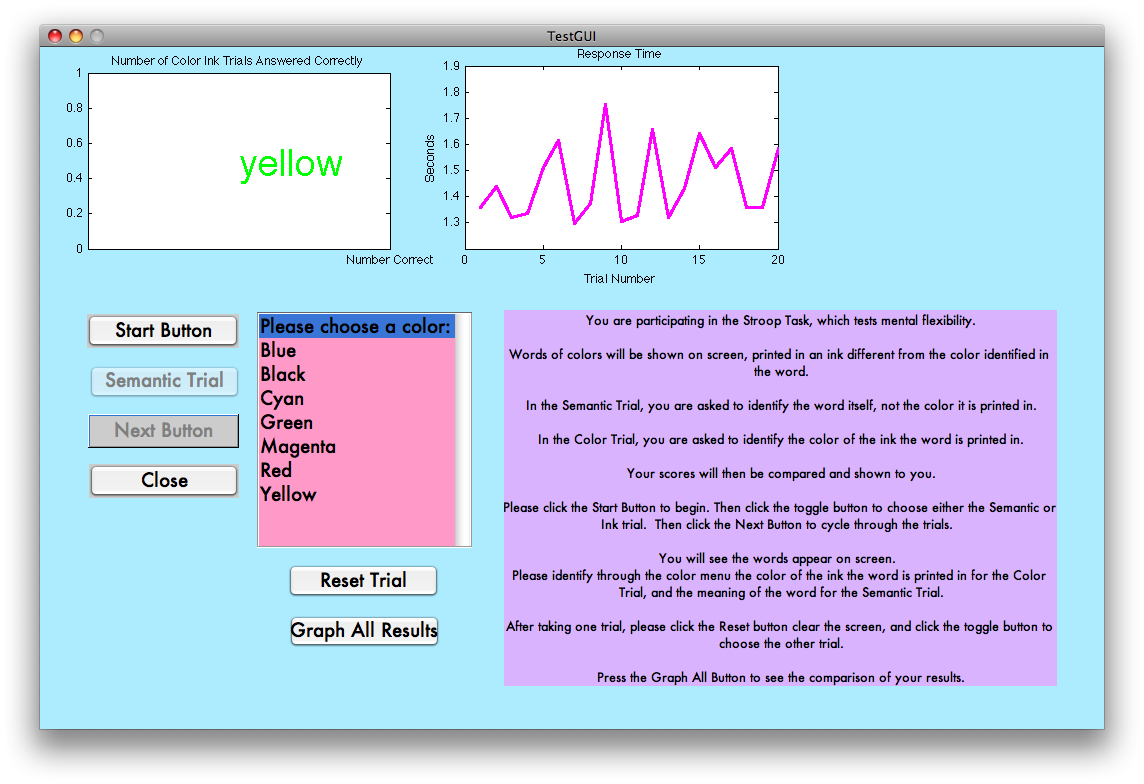
Stroop Effect
Sarah Seigel '11
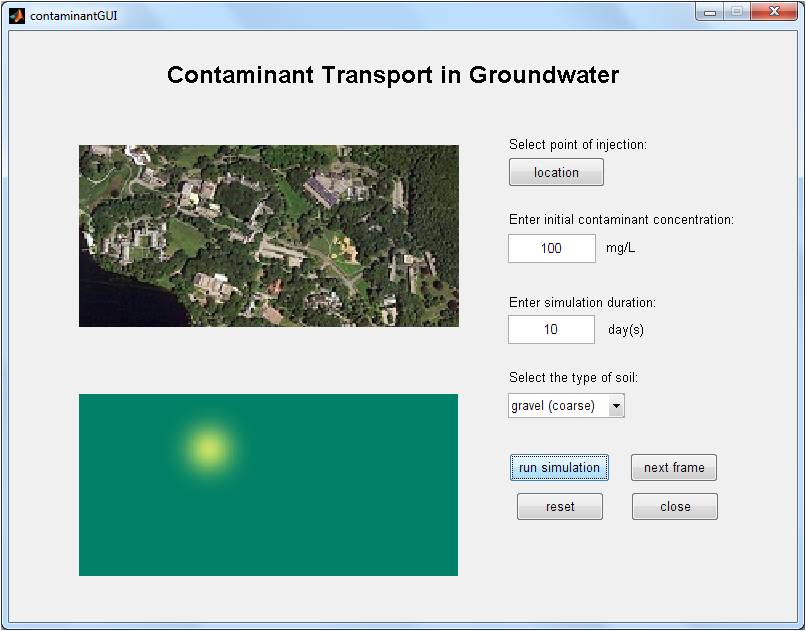
Contaminant
Stephanie Lau '11
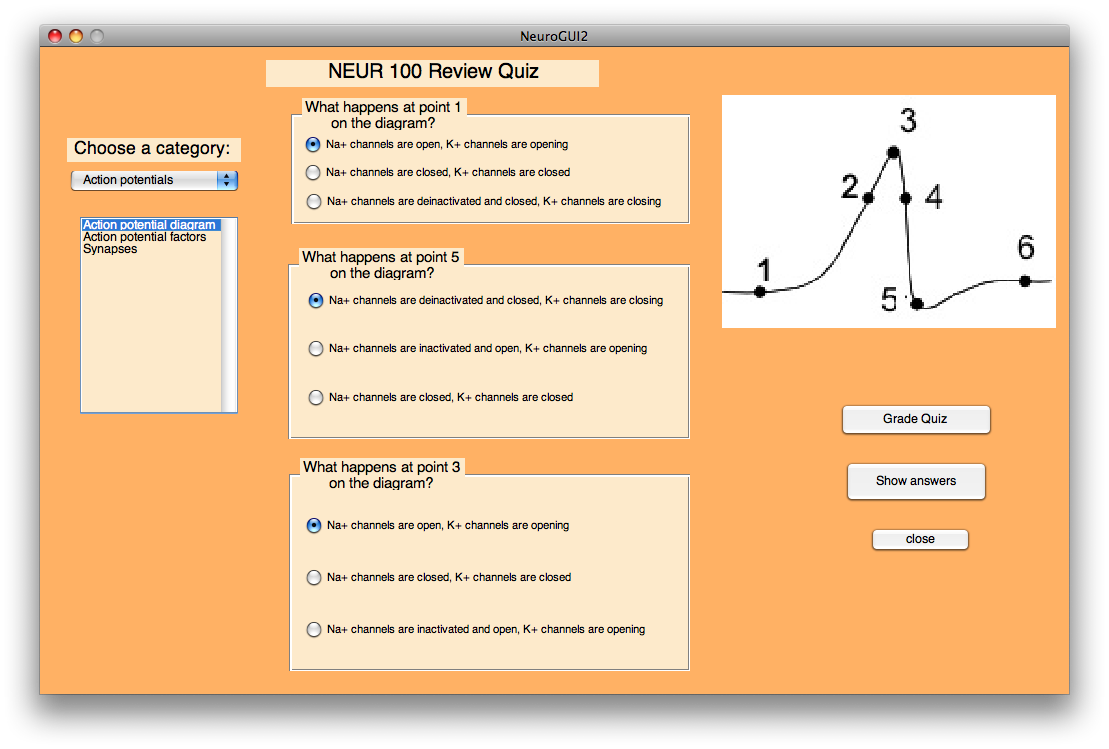
Neuro Quiz
Preeti Viswanathan '14
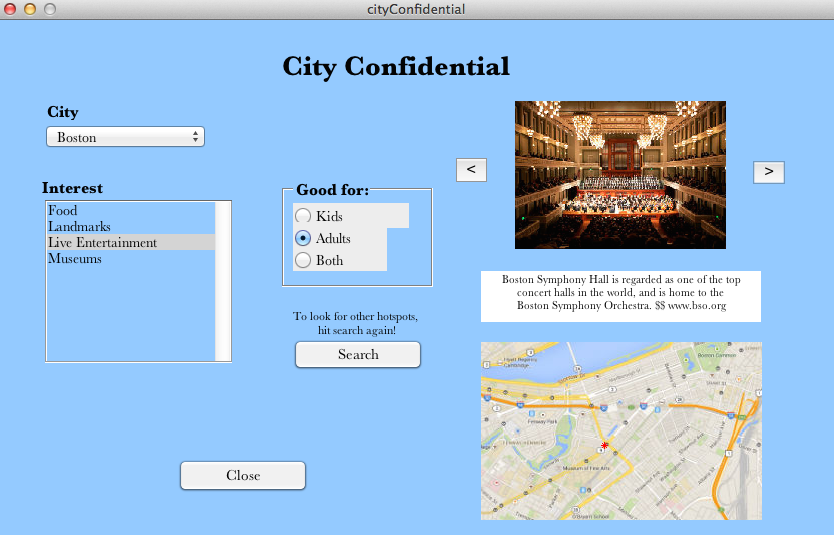
City Confidential
Mika Maeda '14 and Sarah Mejia '14
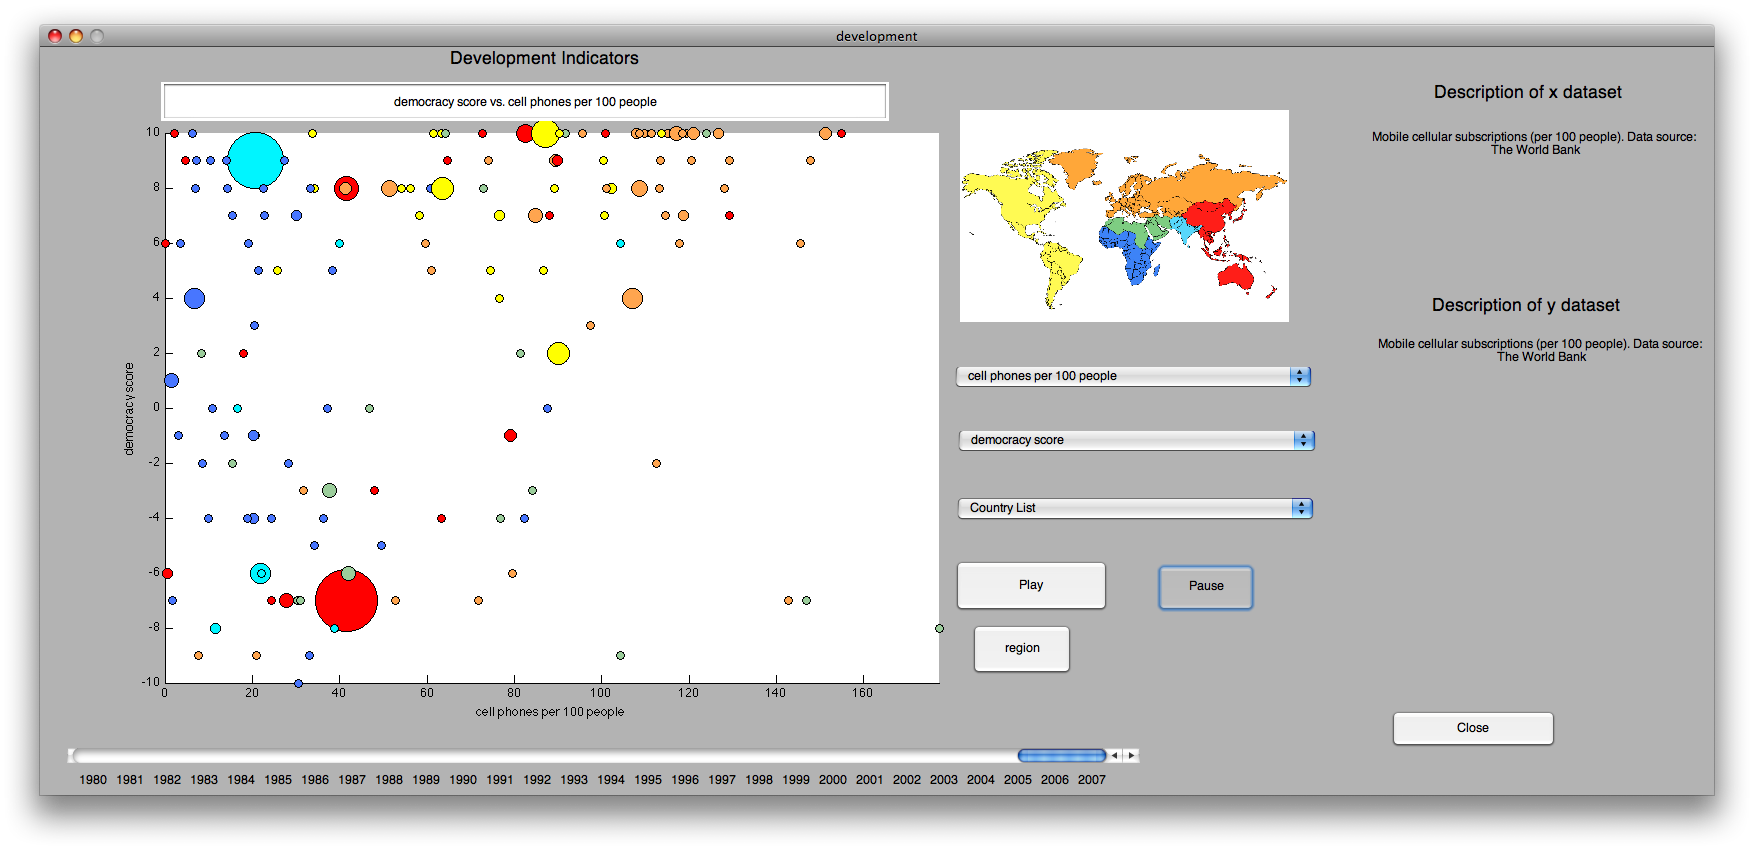
Economic Data Visualization
Lily Zhou '11
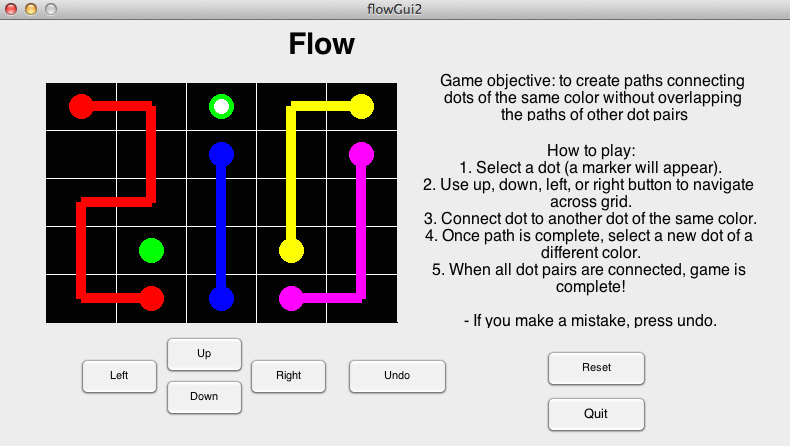
Going with the Flow
Nour Azzouz '15 and Selina Sotomayor '16
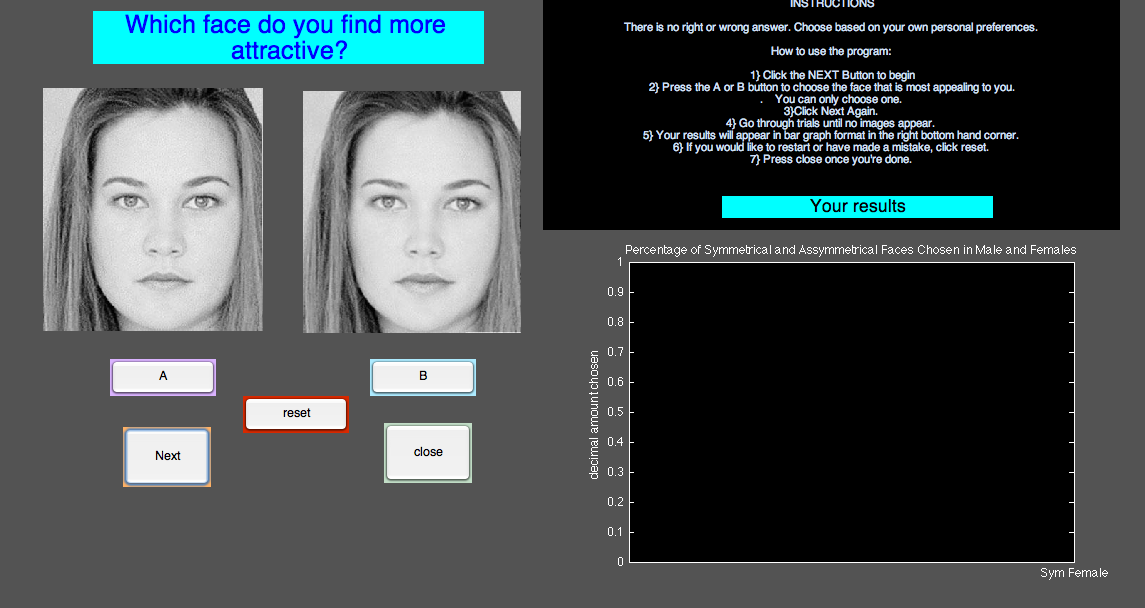
Face Symmetry
Yrianna Germosen '13
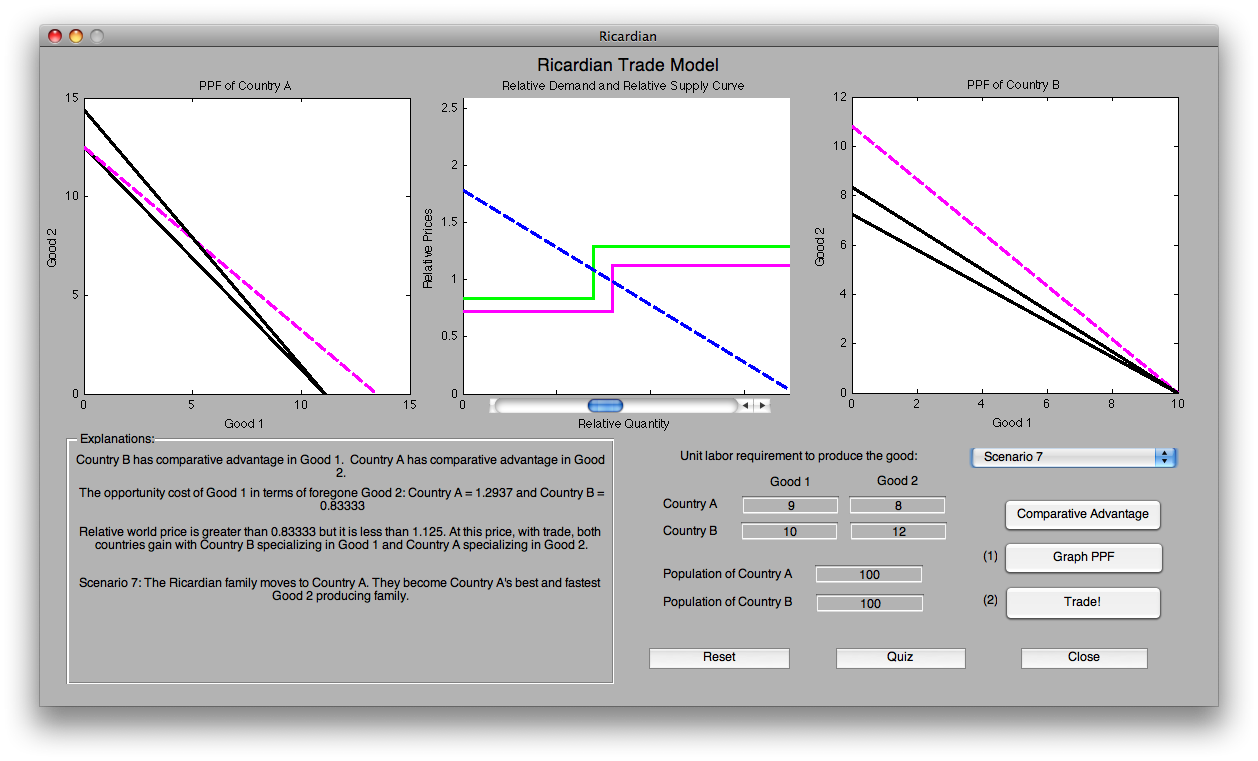
Economics: Ricardian Model
Jenny Poon '11
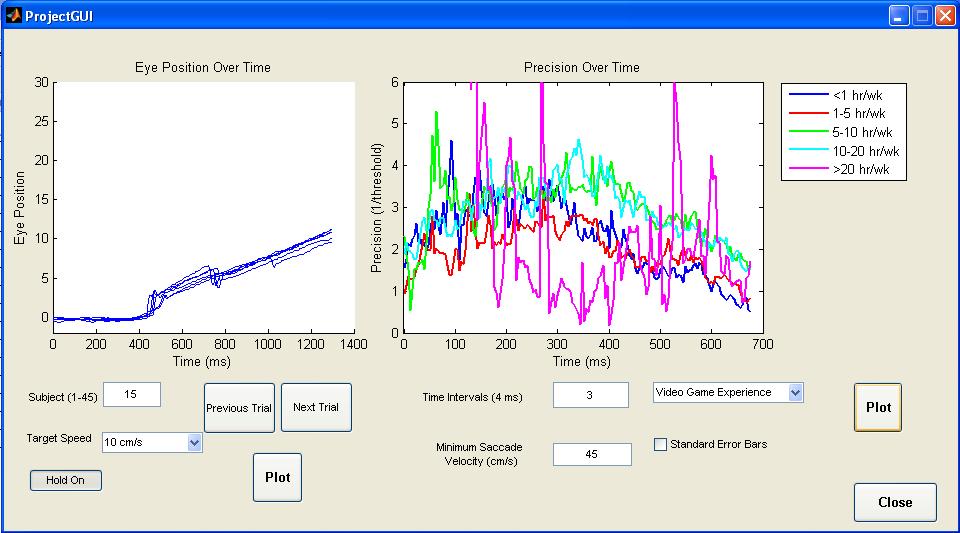
Viewing Eye-Tracking Experimental Data
Sarah Koopman '11
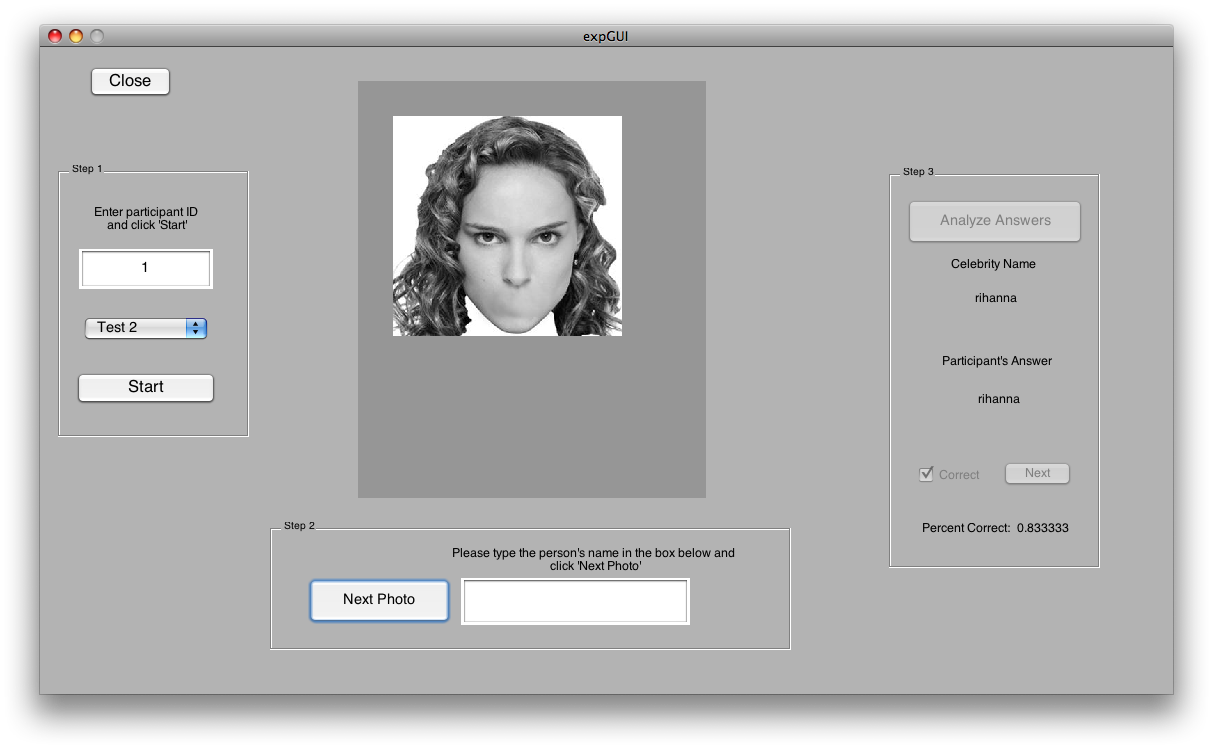
Psychology: Face Recognition
Tiffany Ho '10
Once Upon a Time
Jessica Kelemen '16 and Lynn Hsu '15
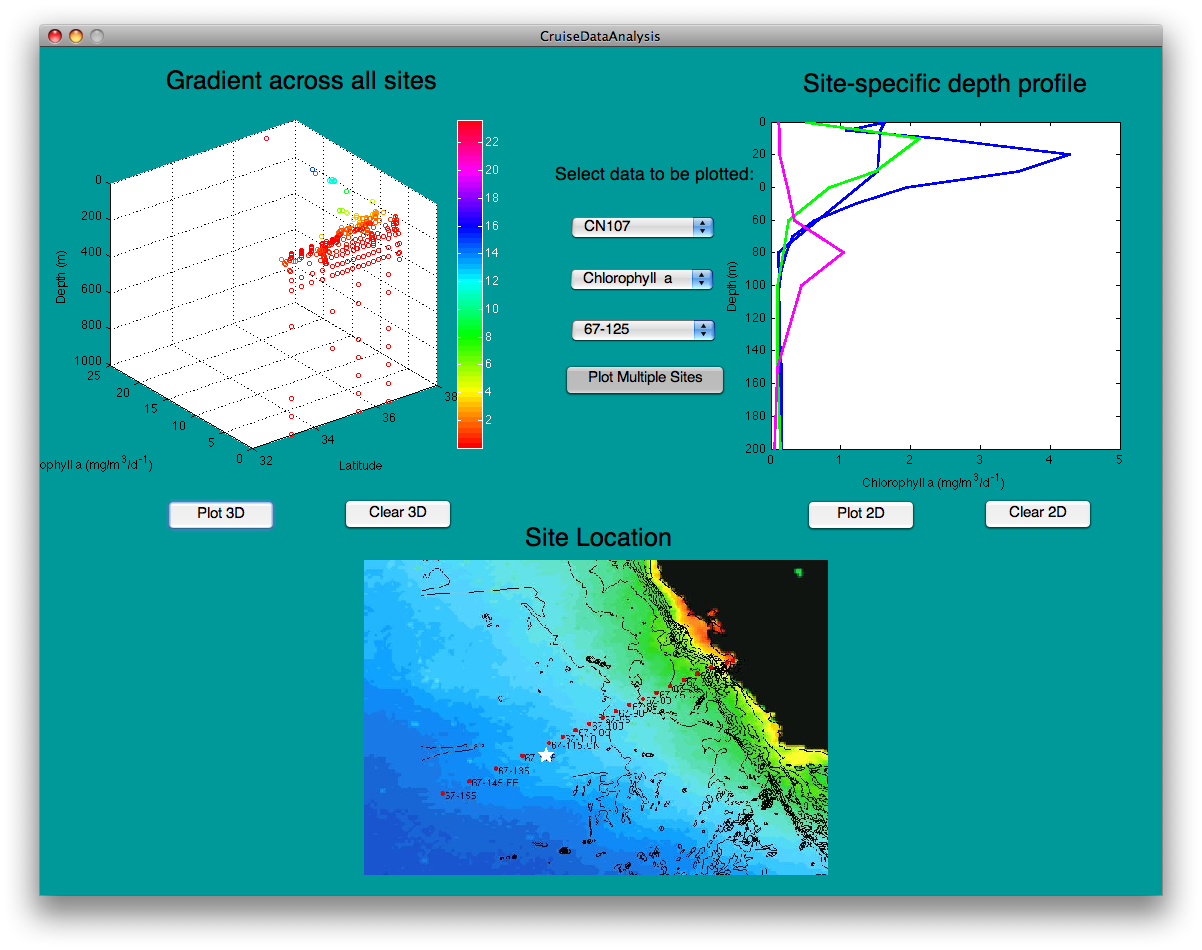
Biology: Tracking Species Across Depth and Location
Harriet Alexander '10
Macroeconomic and Financial Condition Analysis
Leslie Shen '10

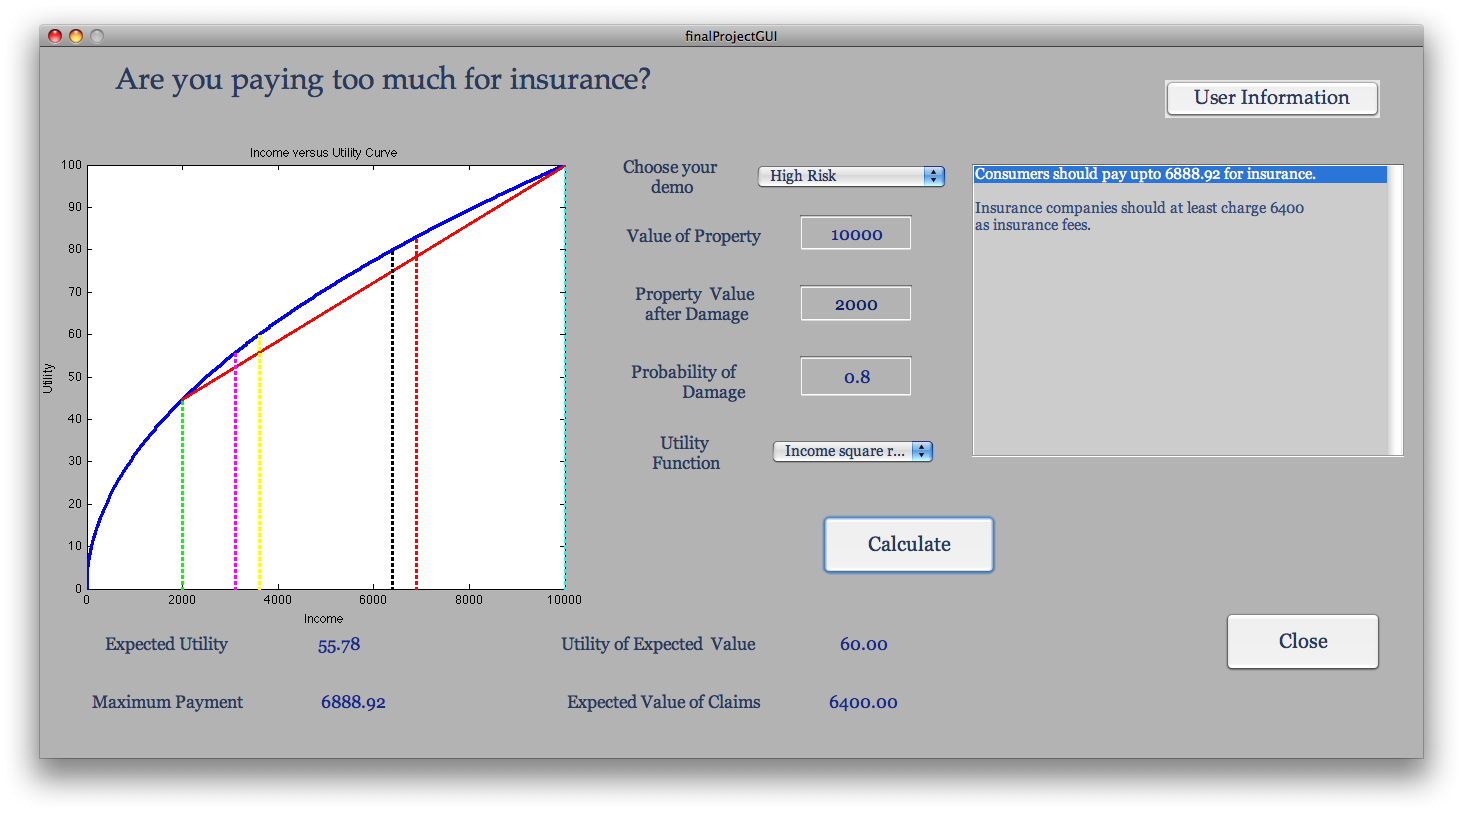
Determining Insurance Costs
Rifaiyat Mahbub '12
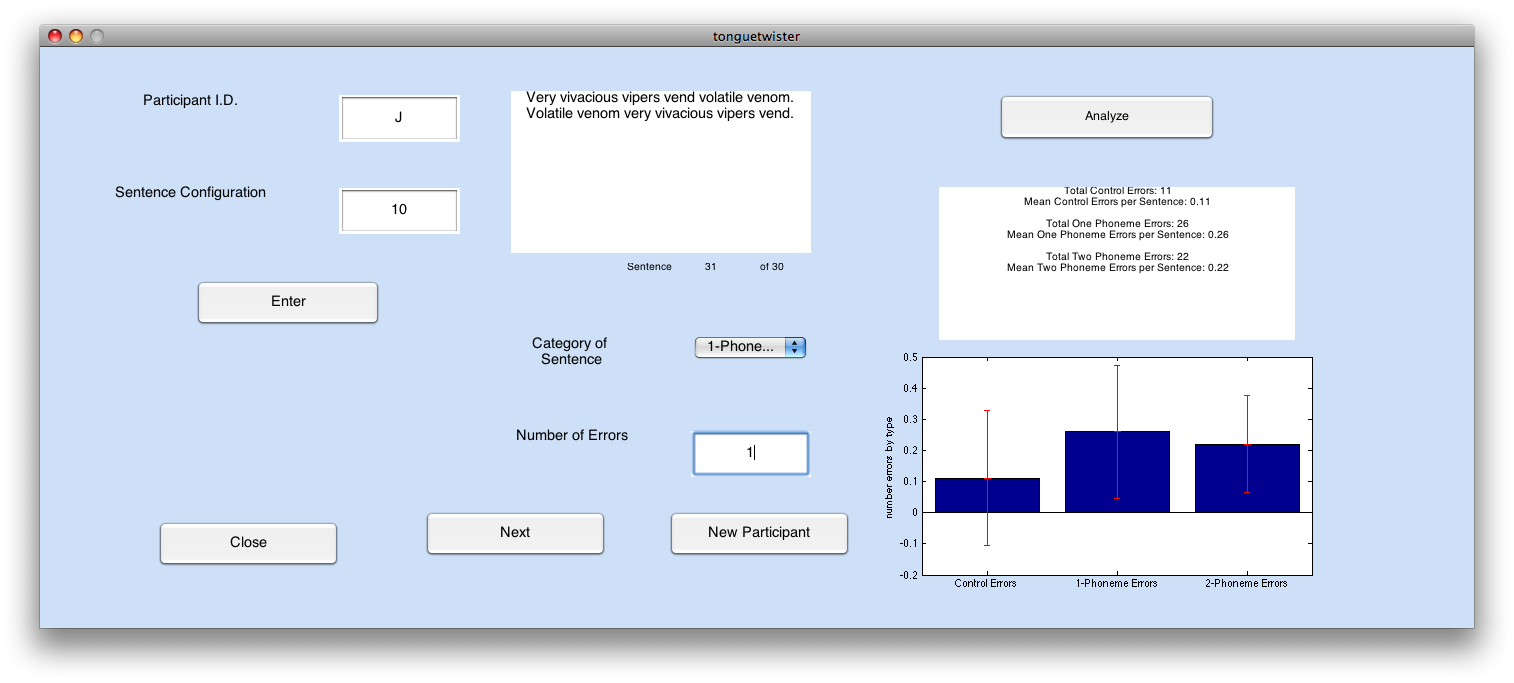
Psychology: Tongue Twister Experiment
Simone Dufresne '12
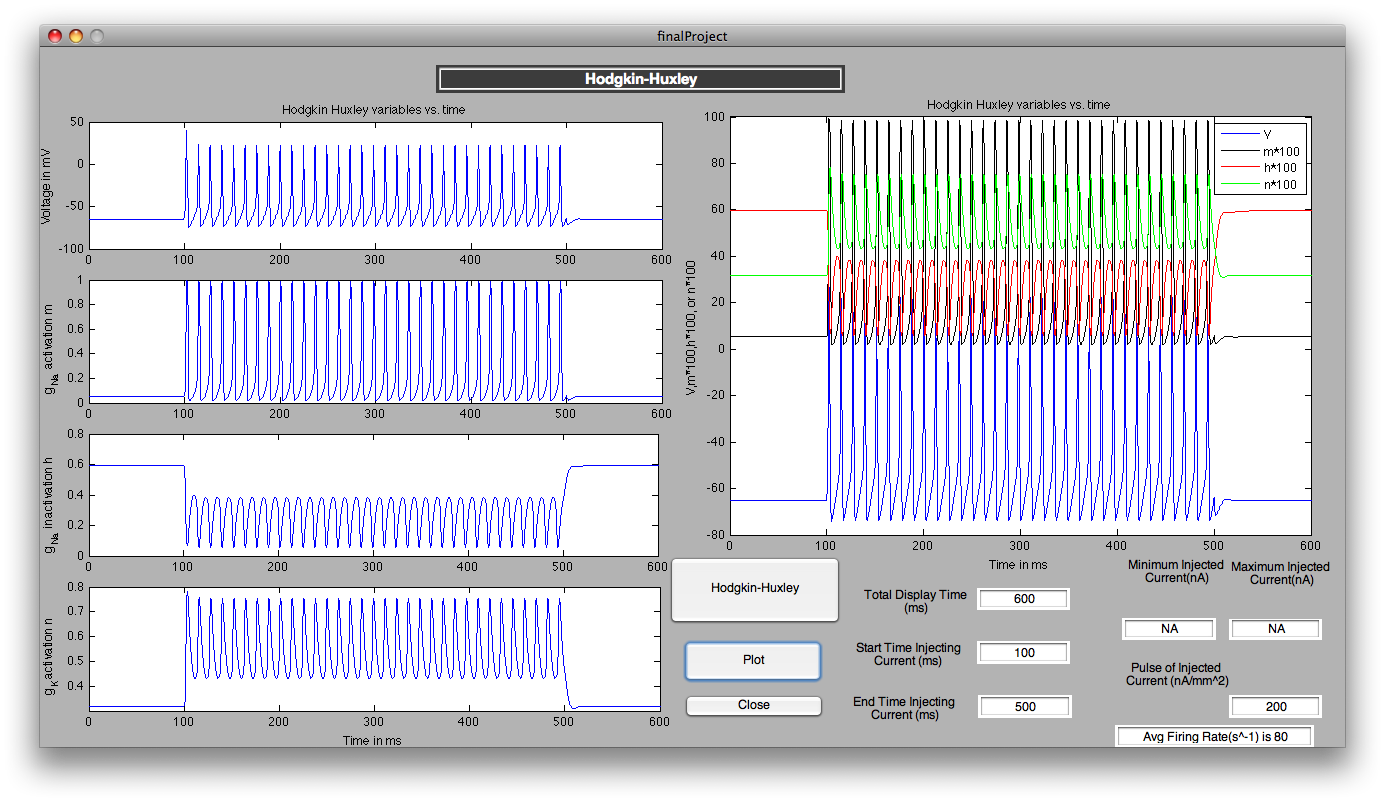
Hodgkin-Huxley / Integrate and Fire Neuron Models
Lily Zhang '12
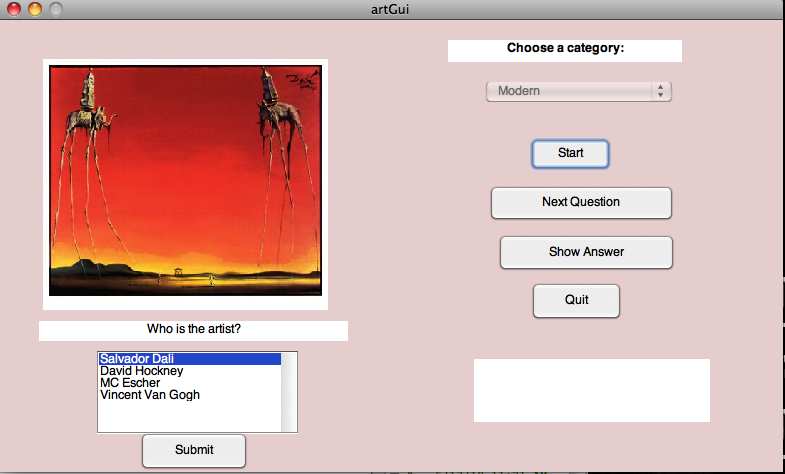
Art History: Identifying Artists and Paintings
Christina Nava '13
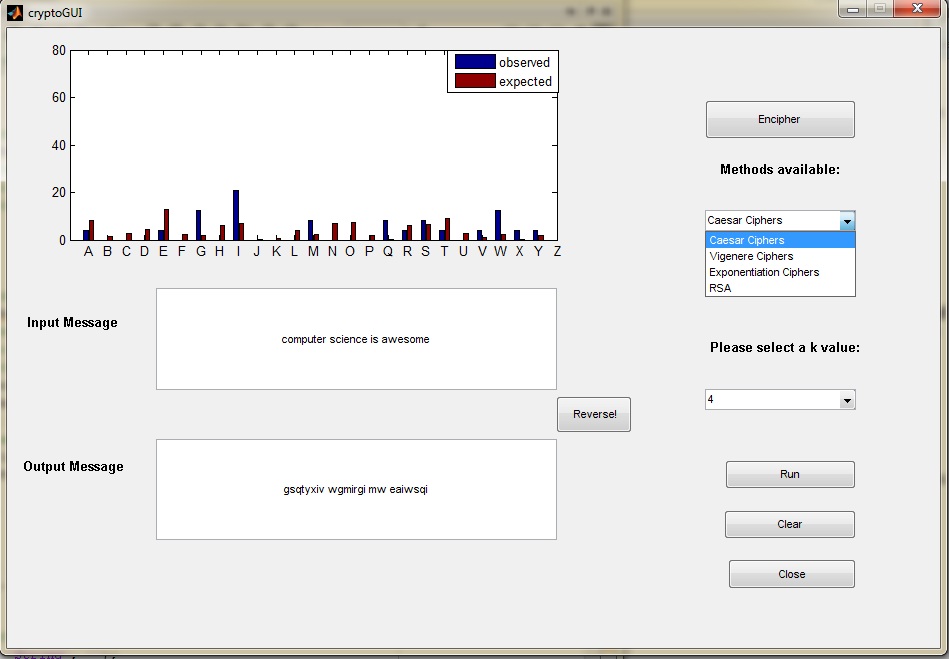
Mathematics: Cryptography
Serena Zhan '11
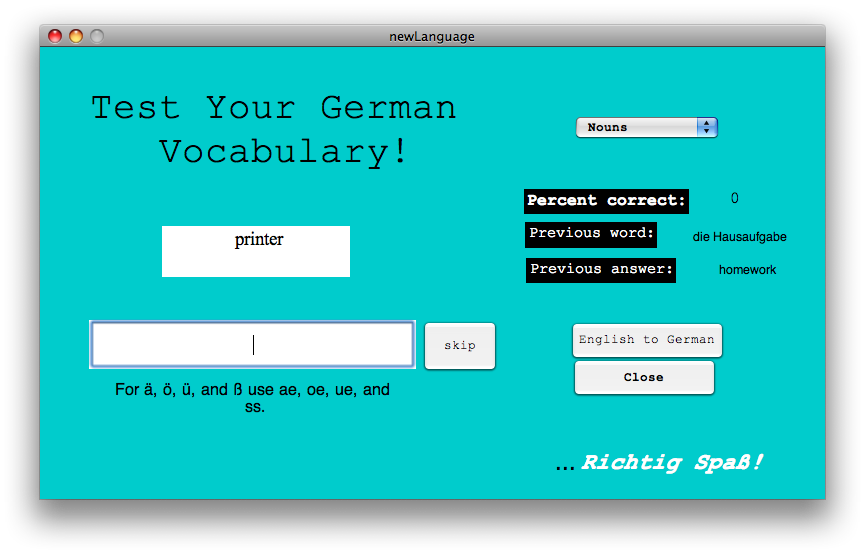
German Vocabulary Quiz
Clara Buchholtz '12
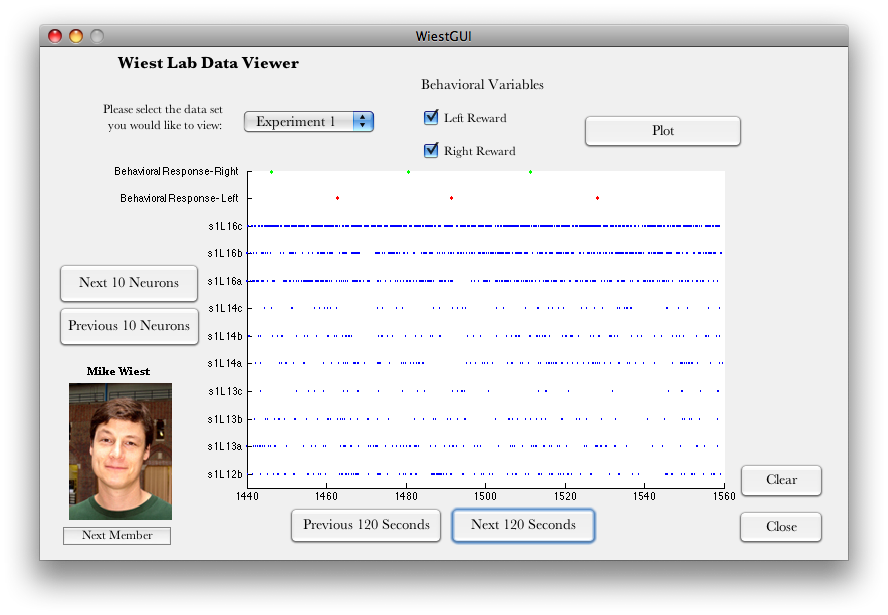
Neuroscience: Viewing Single Cell Brain Data
Marken Shedd '11
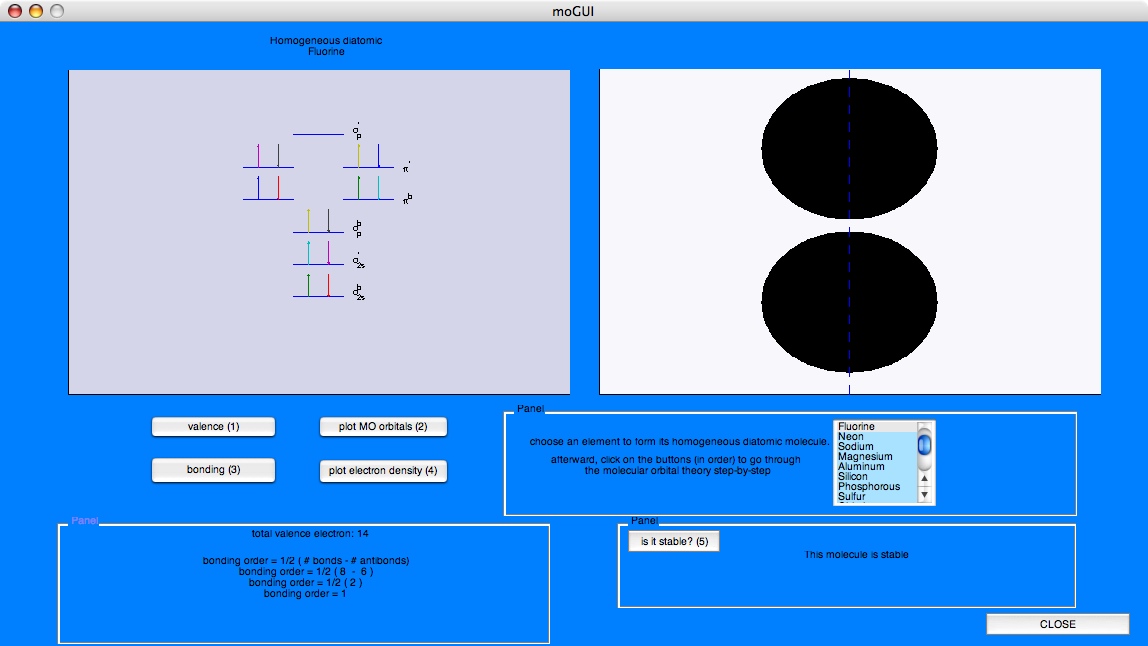
Molecular Orbital Theory
Thanh Thu Ngo '10
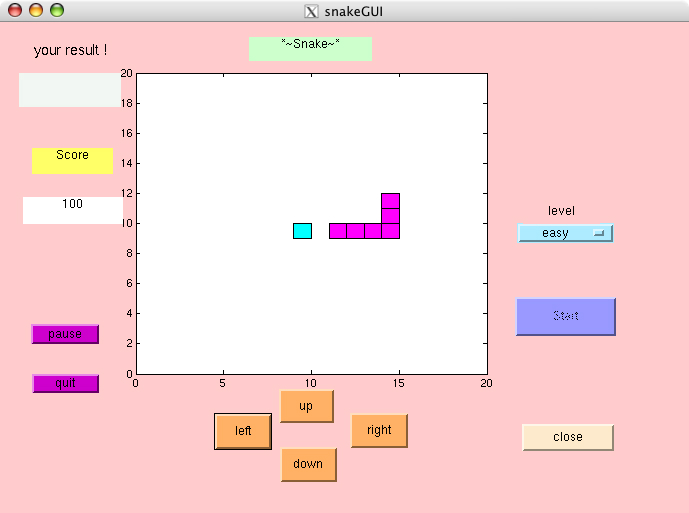
The Snake Game
Abigail Perry '06