|
CS 332
Assignment 1 Due: Wednesday, September 29 |
|
The first problem on this assignment reinforces some basics of MATLAB and the use of 2D matrices to store images, where the value at each matrix location represents the light intensity at a particular location in a 2D image. In Problems 2 and 3, you will examine the intensity changes in a natural image at multiple scales and explore how the early stages of processing in human vision can lead to visual illusions. Two final programming problems explore simple applications, counting the number of cells in an image of a cell culture and recognizing fingerprints. Your primary tasks are highlighted in purple.
Code files (M-Files) and images for this assignment are contained in the edges,
assign1, and assign1images subfolders stored inside a high-level
folder named Assign1_edge_detection. You can access this folder through this
Assign1_edge_detection zip
link, which is also
posted on the course schedule
page. Unzip the file and drag the folder to your Desktop, or drag to a folder
that you create on your local machine, to store your work for this course. (Note that you can also
download the Assign1_edge_detection folder from the /home/cs332/download
directory on the CS server — in this case, connect to your account using
Cyberduck on a Mac or PC, navigate up to the root directory
/, then down to /home/cs332/download, and drag the
Assign1_edge_detection folder to your Desktop or CS332 folder.)
In MATLAB, set your Current Folder to the assign1 subfolder and add the
assign1images and edges folders to the MATLAB search path.
To complete the second step, first click on the Set Path icon in the toolbar
at the top of the MATLAB Desktop. In the dialog box that appears, click on the
Add with Subfolders button. In the new dialog box that appears, navigate to the
top-level Assign1_edge_detection folder and click the Open
button. This should add the top-level folder and its three subfolders to the MATLAB
search path, enabling direct access to all files contained in these
folders. When done with adding the folders to the Search Path, click on the
Close button in the original dialog box.
Submission details: Submit an electronic copy
of your code files by dragging your assign1 subfolder into the
cs332/drop subdirectory that was added to your account on the CS file server.
All of the code in this assignment can be completed collaboratively with your partner(s), but each
of you should drop a copy of this folder into your own account on the file server.
Be sure to document all the code that you write.
For Problems 2 and 3, you will describe in words, your observations about the results of edge
detection, and provide explanations for two visual illusions. You and your partner(s) should
try to compose these answers together, in a shared Google doc. You can then submit this work
by sharing the Google doc with me — please be sure to grant Edit privileges to me
so that I can provide feedback directly in the Google doc.
Problem 1 (15 points): Creating an image of rectangular and circular blocks
In MATLAB, it is easy to create an image with rectangular blocks of uniform intensity.
The following function adds a rectangular block to
an input image and returns the modified image. The horizontal coordinates range
from xleft to xright and vertical coordinates range
from ytop down to ybottom.
    function newImage = addBlock(image, xleft, xright, ytop, ybottom, intensity)

    newImage = image;      % create a copy of the input image

    % set a rectangular area of newImage to the input intensity

    newImage(ytop:ybottom, xleft:xright) = intensity;
The commands below create an initial blank image (2D matrix of 8-bit numbers), add one gray rectangular block, and display the new image. A diagram of the image with labeled coordinates is shown below the code.
    >> image = uint8(zeros(100, 100));

    >> image = addBlock(image, 20, 80, 30, 60, 120);

    >> imtool(image);

The coordinates shown at the four corners of the diagram above, and at the borders of the
gray rectangle, correspond to the pixel coordinates (X,Y) printed
in the bottom left corner of the Image Tool display window. In pixel coordinates, the
location of the upper left corner of the gray block is (X,Y) = (20,30). When
referring to the indices of the corresponding location in the image matrix,
the order of the two dimensions is reversed, so the matrix location of
this upper left corner is image(30,20) (i.e. row 30, column 20, of the
image matrix). Carefully examine the relationship between the input coordinates
in the above MATLAB commands, the indices in the addBlock function, and the
position and size of the block in the image.
The assign1 folder contains the addBlock function (defined
in the addBlock.m code file) and a
script file named makeBlocks.m that uses addBlock to create
an image of three blocks with different shades of gray.
Complete a MATLAB function named addCircle that
adds a circular block of uniform intensity to an input image. The
addCircle.m file in the assign1 folder contains the header for
this function and comments about what the function should do. The function has five inputs and
one output as shown below:
function newImage = addCircle(image, xcenter, ycenter, radius, intensity)
Assume that the input image is a 2D matrix
that already exists. The circular patch of intensity should be centered at
pixel location (X,Y) = (xcenter,ycenter)
and should have the specified input radius and intensity.
Unlike the addBlock function, you will need to write nested for loops
to step through each location in the region of the matrix where the circle is added,
to determine whether the location lies inside the circle. Think about how to implement
this function in a way that avoids unnecessary computations, and place a semicolon at the
end of statements that generate values, to avoid unnecessary printout. You can assume
that this function will be called with appropriate input values for a circle that lies within
the bounds of the matrix.
The makeBlocks.m script in the assign1
folder contains two calls to the addCircle function that you can uncomment to
test your function.
Problem 2 (20 points): Processing a real image
This problem introduces you to the software we will use for edge detection, and is also an
exercise in careful observation. In particular, you will describe your observations of the
zero-crossings obtained from the
convolution of a real image with Laplacian-of-Gaussian convolution operators of different size.
The yachtScript.m script in the assign1 folder illustrates the processing
steps needed to generate the zero-crossing representations and to display the image and results.
The functions to perform these steps can be found in the edges folder, which also
contains a file named edgesCode.pdf that provides a brief summary of all the
functions.
First open the yachtScript.m file
in the MATLAB editor to see the code that will be executed. The yacht image is a
512x480 8-bit gray-level image of a sailing scene that is displayed using
imtool. The image is convolved with two Laplacian-of-Gaussian operators with
w = 4 and w = 8. Two representations of the zero-crossings of each
convolution are computed — the first stores the slopes of the zero-crossings in the matrices
zc4 and zc8, and the second stores only their locations in the
matrices zcMap4 and zcMap8. All of the zero-crossings are preserved
in the latter representation. The two zero-crossing maps are displayed superimposed on the
original image, using imtool. Execute this script by typing yachtScript
in the Command Window (it may take some time to compute the convolutions). The three images
that are displayed may initially be superimposed in the same region of the screen and can be
dragged apart with the mouse. You can enlarge each image by dragging a corner of the imtool window
to a larger size and using the magnifying-glass icon at the top of the imtool window.
Carefully examine the behavior of the zero-crossings for the two different operator sizes and answer the
following questions, in a Google doc shared with your partner(s).
How well do they match up with intensity changes that you see in the
original image? How accurately do they seem to reflect the positions of the intensity changes?
Are there "spurious" zero-crossings that do not seem to correspond to real edges in the original image?
Describe specific examples of features in the image that are captured well by the zero-crossings,
and places where the zero-crossing contours do not seem to correspond to a real edge in the
image. Observe the image and the slopes of the zero-crossings side-by-side (the
zc4 and zc8 matrices can be displayed using the displayImage
function, with a border of 8 and 16, respectively). Do the slopes seem
to be correlated with the contrast of the corresponding intensity changes in the image?
Problem 3 (15 points): Visual illusions
In this problem, you will relate the results of edge detection to human perception.
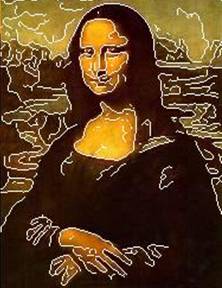
Part a: The sun illusion
We sometimes perceive contours in the visual image that do not correspond to real changes of intensity or edges in the original image. Such contours are referred to as illusory or subjective contours. Some examples of this phenomenon are shown below:

In the case of the "sun illusion" shown on the far right, we perceive a bright central disk that is not really present in the image. Sometimes we can offer a possible explanation for why these illusory contours arise, based on the nature of the early processing of intensity changes that takes place in the visual system. In this part of the problem, you will examine the zero-crossings that result from the convolution of the sun image with Laplacian-of-Gaussian operators of different size, in search of such an explanation.
The sunScript.m code file in the assign1 folder provides some initial
code for analyzing a sun image created with the makeSun function. This
code convolves the image with a Laplacian-of-Gaussian operator of size w = 5 and
computes the zero-crossings. The image and zero-crossings are both displayed using
imtool. At this scale, the zero-crossing contours surround each spoke of the sun
wheel. Add code to the sunScript.m file to generate
zero-crossings from
convolutions with larger Laplacian-of-Gaussian operators of size w = 10 and
w = 20. Observe the zero-crossing contours obtained from all three operator sizes and
describe how they change as the operator size is increased. Based on this analysis, formulate a
possible explanation for the sun illusion. Add your comments to the Google doc shared
with your partner(s).
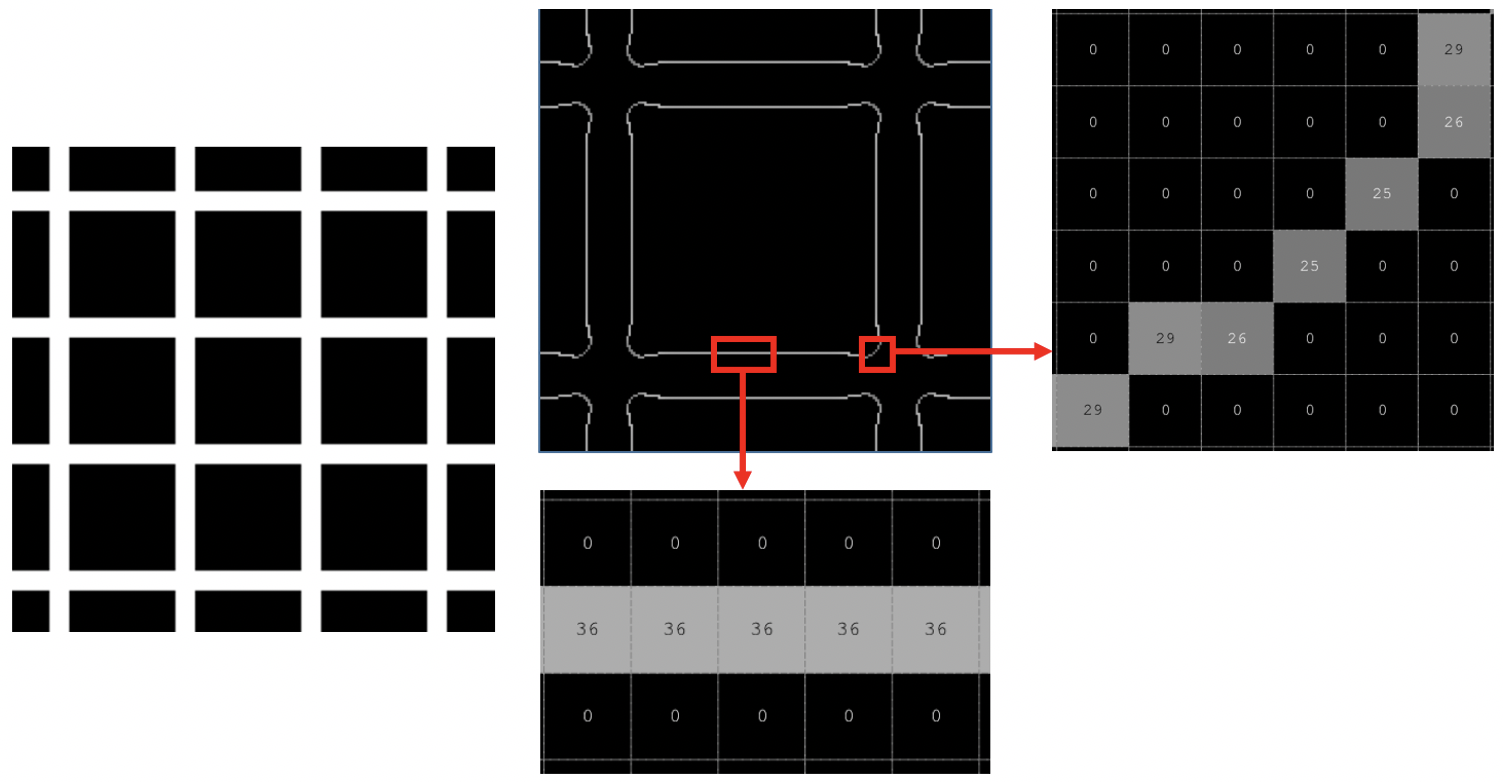
Part b: The Hermann grid illusion
The image on the left below illustrates the famous Hermann grid illusion, where you perceive dark shadowy dots in the vicinity of the intersections of the white bars of the grid, except at the intersection that you are looking at directly. The top figure in the middle shows a small window of the zero-crossing contours derived from convolving the Hermann grid image with a large Laplacian-of-Gaussian operator (analogous to the larger operator sizes that exist in the peripheral regions of the visual field in human vision). The other two figures display the slopes of the zero-crossings obtained in the middle of the white bars (bottom figure in the middle) and in the vicinity of an intersection (figure on the right). The slopes are large in the middle of the bars (value of 36) and smaller in the vicinity of the intersection (values of 25-29). Suppose the human visual system interprets the slopes of the zero-crossings as proportional to the contrast (change in brightness) across edges, and then infers the brightness within regions of an image from these measurements of contrast. Assume that the large black square regions of the grid are perceived as having uniform darkness. How could you explain the perception of the shadowy dots at the intersections, given the slopes of the zero-crossings shown below?
Problem 4 (10 points): Blurring an image
One way to blur an image is to calculate the average intensity within a neighborhood of each
location. Write a function named blurImage that creates a blurred version of an image
using this technique. This function should have two inputs that represent the input image and the
size of the neighborhood, and a single output that is the new, blurred version of the image. Assume
that the input image is a 2D matrix of gray-level intensities ranging from 0 to 255 (i.e. of type
uint8). The output matrix should be the same size as the input matrix, and can be created
initially using the uint8 and zeros functions. Suppose we let
nsize denote the input neighborhood size. Then the value stored in location (x,y)
of the output matrix should be the average of the intensities in the input matrix calculated over a
square region from (x-nsize,y-nsize) to (x+nsize,y+nsize). This average can
be converted to an integer using the round function. You do not need to calculate average values for
the region of width nsize around the outer border of the image (these values can remain
zero). Think about how the built-in mean function combined with colon notation can be used
to compute the average intensity values within a square neighborhood around each location — you do not
need to create an additional pair of nested for loops to perform this step. Test your
function by creating blurry versions of simple images that you created in Problem 1.
Problem 5 (20 points): Counting cells
This problem provides some practice with writing a MATLAB script to analyze an
image of red blood cells. This image is contained in the file cells.jpg
inside the assign1images folder.

Your goal is to compute a rough estimate of the number of cells in the image. Fortunately, the cells are all darker than the background and fairly well separated from one another. If you can determine the approximate number of pixels covered by a typical cell, you can then estimate the number of cells by counting the total number of dark pixels in the image and dividing this quantity by the number of pixels in a single cell.
Create a new script file named countCells.m and save it
in your assign1 folder. The script should first load the color image cells.jpg
(this file will be directly accessible if the assign1images folder is on the MATLAB search
path), convert it to a gray-level image using the MATLAB rgb2gray function, and display
the resulting gray-level image.
Use the MATLAB help system to learn how to use rgb2gray.
Next, add code to create a binary image that is a 2D
matrix of logical values 0 and 1, where 1 is stored at locations where the cells
image contains a dark intensity value (indicating a blood cell) and 0 is stored at locations of bright
intensity (the background). To implement this step, note that a logical expression can be applied
to an entire vector or matrix all at once, producing a vector or matrix of logical values 1 and 0
(analogous to true and false, respectively). For example, the following statement creates a binary image
containing a logical value 1 at locations where the image intensity is greater than 100, and 0 elsewhere:
>> newImage = (image > 100);
Your binary image of cells might look something like this:

It may take some trial-and-error to find a threshold between dark and light that does
a good job of separating the cells from the background — the Pixel Region tool in
imtool can be helpful here. Add code to display the binary
image in a new figure window, by calling the figure function before displaying the image.
Your final steps are to estimate (1) the number of pixels covered by all the blood cells in the image, (2) the number of pixels in a single, isolated cell, and finally, (3) the approximate number of cells in the image, using the strategy described earlier. Given the binary representation of the cells image, how can you determine the total number of pixels corresponding to cells? Hint: You can do this with one statement, and no loops! To estimate the number of pixels in a single, isolated cell, create a copy of a small region of the binary image that includes a single, isolated cell. You can create a copy of an image region as shown in the following example:
>> patch = image(30:60,40:80);
It may again take some
trial-and-error to find the indices of a rectangular region that just spans a single cell - if
you use imtool to help, remember that the X and Y
coordinates listed in the lower left corner of the
imtool window indicate the column and
row, respectively, of the matrix location corresponding to your cursor position.
Display your small matrix to see if you
succeeded in capturing a single cell. Determine the number of pixels covered by the single cell using
the same strategy that you used for the full image. Add statements to
the countCells script to perform these final steps and print your estimate of the number
of cells in the original image (you
can just omit the semicolon at the end of the statement that performs this final calculation).
 Problem 6 (20 points): Whodunit???
A heinous crime was committed in the Computer Science department this past weekend — someone stole Captain Abstraction's suit while he assumed his alter-ego as a mild-mannered computer science professor! Even more shocking, it appears to have been an inside job! The circumstances of the crime point in the direction of a CS faculty member — Takis, Sohie, Orit, or Brian! One piece of evidence was left at the scene, a lone partial fingerprint. The CS332 class has been recruited by the Wellesley campus police to help nail the culprit. Fortunately we have a fingerprint on file for each of our four suspects. Your mission is to complete a MATLAB program to identify the mystery fingerprint.
The fingerprint images for this problem can be found in the assign1images folder,
and partial code is provided in the fingerprintScript.m code file in
the assign1 folder. The fingerprintScript code reads in five images
that include fingerprints
for the four suspects (240x256 pixel images) and the mystery partial fingerprint (a 51x51 pixel
image named finger.jpg). This script displays the four known fingerprints in a
2x2 arrangement within a single figure window using the MATLAB subplot function, and
displays the mystery partial fingerprint in a separate figure window. There is additional code
at the end of the script that determines the identity of the culprit. This code is initially
commented out and can be executed after you complete the definition of the getMatch
function described below.
The goal of the program is to determine which of the four suspect fingerprint images
best matches the mystery partial fingerprint image. Of course, the partial fingerprint
will only match a small portion of one of the full fingerprint images. To assist in this
process, define a new function getMatch that has two inputs,
a partial fingerprint image and a full fingerprint image. This function should return a number that
quantifies the best match between the partial fingerprint and the most similar patch of the
full fingerprint image.
The similarity between two image patches of the same size can be measured, for example, by first
computing the absolute difference between the values stored in corresponding locations
of the two patches, and then summing these differences over the patch. This so-called
sum of absolute differences is a common measure used in computer vision.
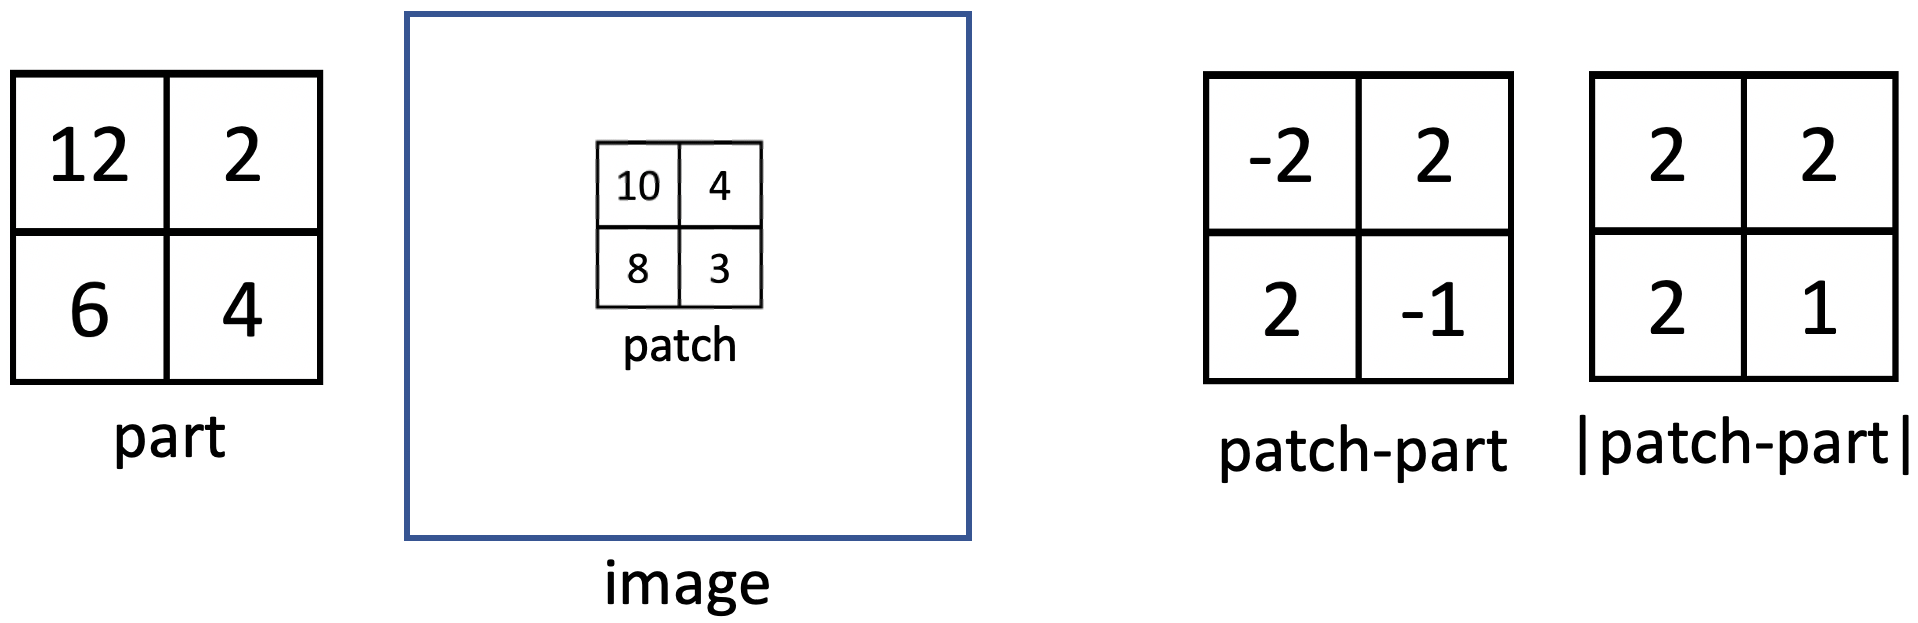
Suppose, for example, you want to
search for a 2x2 patch in an image that best matches the
2x2 pattern shown below on the left, named part. For each
2x2 patch in the image, you can first compute the element-by-element difference between
the patch and the desired part. For the example below, this gives the values on
the right labeled patch-part. The absolute value of these differences, which can be
computed with the abs function in MATLAB, indicates how much the corresponding
pixel values differ, as shown below on the far right.
These values can be summed over the patch to yield an overall measure of
similarity between the patch and part, which yields a value of 7 for
the example below. The best matching patch in the image would be the one with the smallest sum of
absolute differences. Using this logic, the getMatch functiion should return the
smallest sum-of-absolute-differences that exists between the input partial fingerprint and a patch of
the same size in the full fingerprint image.
Tip: You will need to write nested for loops to systematically check
all possible image patches, but you do not need additional loops to compute the
sum-of-absolute-differences between two patches. The function named fuzzy in the
MATLAB documentation may provide
a hint about how to implement this.
After completing the definition of getMatch, uncomment the statements
in the fingerprintScript.m code file that compute values that capture how well the
partial fingerprint matches the fingerprints of Takis, Sohie, Orit, and Brian, and then use these
match values to determine who committed this horrific crime.