User Guide
- Obtaining Rockhopper
- Quick start with example files
- Reference Based Analysis
- The file summary.txt contains the same information as that shown in the progress window.
- The file *_transcripts.txt is a tab-delimited text file that can be opened by your favorite spreadsheet program. The file contains information for each gene and for each newly predicted transcript, including predicted transcription start and stop sites, expression levels in each experimental condition, and q-values indicating differential expression between experimental conditions (by default, Rockhopper considers q-values less than 0.01 to be significant).
- The file *_operons.txt is a tab-delimited text file that can be opened by your favorite spreadsheet program. The file contains information about each multi-gene operon predicted by Rockhopper.
- De Novo Analysis
- The file summary.txt contains the same information as that shown in the progress window.
- The file transcripts.txt is a tab-delimited text file that can be opened by your favorite spreadsheet program. The file contains information for each assembled transcript, including the transcript's sequence, length, expression levels in each experimental condition, and q-values indicating differential expression between experimental conditions (by default, Rockhopper considers q-values less than 0.01 to be significant). In the example above, no q-values are reported in the file because there was a single experimental condition and q-values are only reported when there are multiple experimental conditions.
- Input files
- Rockhopper execution
- Aligning reads to a genome. For the set of replicons selected by the user, Rockhopper creates a Burrows-Wheeler index based on the full-text minute space. After index creation, for each read, an exact alignment to the index is attempted and, if unsuccessful, an inexact alignment to the set of replicons is attempted by aligning seed regions from the read to the index and extending the seed alignments with an optimized dynamic program using a quality aware scoring function based on the error probabilities of the sequencing read.
- Normalization. In order to allow for comparison of data from different samples and experiments, each set of data is normalized by upper quartile normalization.
- Assembling transcripts and identifying transcript boundaries. Translation start/stop sites for annotated protein coding genes and transcription start/stop sites for annotated RNA genes, primarily rRNAs and tRNAs, are obtained automatically by Rockhopper from GenBank or, alternatively, may be supplied by the user. Based on the aligned and normalized sequencing data, Rockhopper uses a Bayesian approach to create a transcriptome map including transcription start/stop sites for protein coding genes and novel transcripts identified by Rockhopper.
- Quantifying transcript abundance. RPKM is a common measure for quantifying gene expression from RNA-seq experiments. RPKM is a measure that sums the number of reads for a gene and divides by the gene's length and the total number of reads, modulo a constant. Rockhopper reports the expression level of each transcript using RPKM, except that instead of dividing by the total number of reads, Rockhopper divides by the upper quartile of gene expression.
- Testing for differential gene expression. First, Rockhopper uses local regression to obtain a smooth estimate of gene expression variances. Then, for each transcript, Rockhopper performs a statistical test for the null hypothesis, which is that the expression of the transcript is the same in different conditions. The Negative Binomial distribution is used as the statistical model to compute a p-value indicating the probability of observing a transcript's expression levels in different conditions by chance. Because multiple test are being performed, q-values are reported that control the false discovery rate using the Benjamini-Hochberg procedure.
- Prediction of operons. Two features are used to estimate the probability that consecutive genes on the same strand are co-transcribed as part of a multi-gene operon: the distance in nucleotides between the genes and the similarity of the genes' expression in the RNA-seq data.
- Visualization of results. Results from Rockhopper are displayed using the Integrative Genomics Viewer.
- De novo transcript assembly. Sequencing reads are used to construct a de Bruijn graph. The de Bruijn graph is traversed to assemble candidate transcripts, which are stored as a Burrows-Wheeler index. Sequencing reads are then aligned to candidate transcripts to hone the candidates into a set of finalized high quality transcripts.
- Normalization. In order to allow for comparison of data from different samples and experiments, each set of data is normalized by upper quartile normalization.
- Quantifying transcript abundance. RPKM is a common measure for quantifying gene expression from RNA-seq experiments. RPKM is a measure that sums the number of reads for a gene and divides by the gene's length and the total number of reads, modulo a constant. Rockhopper reports the expression level of each transcript using RPKM, except that instead of dividing by the total number of reads, Rockhopper divides by the upper quartile of gene expression.
- Testing for differential gene expression. First, Rockhopper uses local regression to obtain a smooth estimate of transcript expression variances. Then, for each transcript, Rockhopper performs a statistical test for the null hypothesis, which is that the expression of the transcript is the same in different conditions. The Negative Binomial distribution is used as the statistical model to compute a p-value indicating the probability of observing a transcript's expression levels in different conditions by chance. Because multiple test are being performed, q-values are reported that control the false discovery rate using the Benjamini-Hochberg procedure.
- Output files
- The file summary.txt contains a summary of analysis results, including information for each replicon on how many reads aligned to the replicon, the percentage of successfully aligned reads that correspond to annotated genomic regions, the number of predicted 5'UTRs, the number of predicted 3'UTRs, the number of predicted novel transcripts (both antisense to annotated genes and in intergenic regions), the number of differentially expressed genes, and the number of multi-gene operons identified. The information output to the summary.txt file is the same as the information output to the Progress window.
- The file *_transcripts.txt is a tab-delimited text file that can be opened by your favorite spreadsheet program. The file contains information for each gene and for each newly predicted transcript, including predicted transcription start and stop sites, expression levels in each experimental condition, and q-values indicating differential expression between experimental conditions. The first four columns of the file indicate transcription start/stop sites and translation start/stop sites. Translation start/stop sites for annotated protein coding genes and transcription start/stop sites for annotated RNA genes, primarily rRNAs and tRNAs, are automatically downloaded from GenBank or may be supplied by the user. Rockhopper does not attempt to identify transcription start/stop sites for genes that are not significantly expressed or for genes that overlap another gene on the same strand, i.e., are not flanked by an intergenic region. In the seventh column, the designation "predicted RNA" indicates a novel transcript prediction and the eighth column indicates if the novel transcript prediction is antisense to an annotated gene. The final columns indicates the expression level of each transcript in each condition and q-values indicate if the transcript was differentially expressed in the specified conditions. q-values are adjusted p-values in order to control the false discovery rate. By default, Rockhopper considers q-values less than 0.01 to be significant. If the Verbose output option is checked in the Parameter Settings window, then additional information will be output to the file, including raw and normalized counts for each transcript in each replicate, RPKM values, and p-values.
- The file *_operons.txt is a tab-delimited text file that can be opened by your favorite spreadsheet program. The file contains information about each multi-gene operon predicted by Rockhopper.
- The file summary.txt contains a summary of analysis results, including for each sequencing reads file the number of sequencing reads in the file and the number and percentage of sequencing reads that align perfectly to the de novo assembled transcripts. Additionally, the number of de novo assembled transcripts is reported along with the average and median length of the transcripts and the sum of the lengths of all assembled transcripts. The information output to the summary.txt file is the same as the information output to the Progress window.
- The file transcripts.txt is a tab-delimited text file that can be opened by your favorite spreadsheet program. The file contains information for each assembled transcript, including the transcript's sequence, length, expression levels in each experimental condition, and q-values indicating differential expression in the specified experimental conditions. q-values are adjusted p-values in order to control the false discovery rate. By default, Rockhopper considers q-values less than 0.01 to be significant. If the Verbose output option is checked in the Parameter Settings window, then additional information will be output to the file, including raw and normalized counts for each transcript in each replicate, RPKM values, and p-values.
- Options and parameters
- Main Rockhopper window
- Reference based or de novo analysis. Use the
red and green "DE NOVO" buttons,
 and
and
 ,
to switch between reference based analysis and de novo
analysis, when reference genomes are available or not,
respectively.
,
to switch between reference based analysis and de novo
analysis, when reference genomes are available or not,
respectively. - Aligning reads to multiple replicons. Use the
yellow buttons,
 and
and  , to add
and remove replicons if your genome of interest has more than one
chromosome or plasmid.
, to add
and remove replicons if your genome of interest has more than one
chromosome or plasmid. - Using custom genomic sequences and gene annotations. Use the
green button,
 , to
indicate a local folder with a genome sequence file and a gene annotation
file rather than use genomic information automatically downloaded
from GenBank.
, to
indicate a local folder with a genome sequence file and a gene annotation
file rather than use genomic information automatically downloaded
from GenBank. - Sequencing read files from different experimental conditions.
Use the red buttons,
 and
and
 ,
to add and remove experimental conditions. Rockhopper
tests for differential gene expression between pairs of conditions,
1 vs 2, 3 vs 4, 5 vs 6, etc., so conditions should be added
in such a way that differential expression will be considered
for appropriate pairs of conditions.
,
to add and remove experimental conditions. Rockhopper
tests for differential gene expression between pairs of conditions,
1 vs 2, 3 vs 4, 5 vs 6, etc., so conditions should be added
in such a way that differential expression will be considered
for appropriate pairs of conditions. - Sequencing read files from replicate experiments.
Use the blue buttons,
 and
and
 ,
to add and remove biological replicates for a given
experimental condition.
,
to add and remove biological replicates for a given
experimental condition. - Paired-end or mate-pair reads.
Paired-end reads often result in a pair of sequencing
read files. Use the red button,
 , to add the second file
in the pair to the first. When the second file in the pair has
been added, the red button will turn green,
, to add the second file
in the pair to the first. When the second file in the pair has
been added, the red button will turn green,
 .
. - Parameter settings menu item. In the Options menu, the Parameter settings menu item will open a new window that will allow the user to customize Rockhopper's parameter values.
- Clear cache menu item. In the Options menu, the Clear cache menu item will remove all temporary information and files stored by Rockhopper. As one example, the first time Rockhopper aligns sequencing reads to a genome, it typically takes several minutes, depending on the number of reads, the length of the reads, the size of the genome, and the speed and number of processors on your computer. After the first time that reads are aligned to a genome, Rockhopper caches the results so that future executions of Rockhopper using the same reads and parameters can use the cached results and thus execute in a matter of seconds. By clearing the cache, results from previous Rockhopper executions will be deleted.
- User guide menu item. In the Help menu, the User guide menu item opens a web page containing this user guide.
- About Rockhopper menu item. In the Help menu, the About Rockhopper menu item opens a window with information about the version of Rockhopper being executed.
- Parameter window
- Strand specific. Some protocols for RNA-seq experiments generate strand specific reads and some generate strand ambiguous reads. The Strand specific parameter indicates whether the sequencing reads are strand specific or not.
- Test for differential expression. To speed up computation, the user can elect to forego testing for differential gene expression.
- Reverse complement reads. If single-end reads are aligning to the opposite strand than expected, then Rockhopper can reverse complement the reads so that they align to the appropriate strand.
- Orientation of mate-pair reads. For paired-end (or mate-pair) reads, each read in the pair is oriented relative to the other read in the pair. The Orientation of mate-pair reads parameter specifies the orientation of mate-pair reads: "ff" correspond to both reads in a forward orientation, "fr" corresponds to the first read in a forward orientation and the second in a reverse complement orientation, "rf" corresponds to the first read in a reverse complement orientation and the second in a forward orientation, "rr" corresponds to both reads in a reverse complement orientation. Most often, mate-pair reads are in the "fr" orientation.
- Verbose output. Enabling verbose output will cause Rockhopper to output additional information to the *_transcripts.txt file, including raw and normalized counts for each transcript in each replicate, RPKM values, expression variances, smoothed estimates of expression variances (based on lowess), and p-values.
- Output SAM file. Output sequencing reads to a SAM file. This option may be useful when incorporating Rockhopper's results into other downstream programs that use SAM files as input.
- Max bases between paired reads. The user can specify the maxiumum distance in bases between mate pairs for paired-end reads.
- Number of processors. For computers with multiple processors, the number of processors utilized by Rockhopper can be specified. If the value 0 is specified (which is recommended), then Rockhopper will self-identify the number of processors and parallelize its computation appropriately to utilize all available processors.
- Output file location. The user can specify the folder where files output by Rockhopper are stored.
- Allowed mismatches. When aligning a sequencing read to a genome, Rockhopper first searches for an exact alignment. If no exact alignment is found, Rockhopper searches for the highest scoring inexact alignment. Inexact alignments may contain gaps and mismatches. The Allowed mismatches parameter specifies the maximum allowed gaps and mismatches in an inexact alignment as a percentage of the read length.
- Minimum seed length. When searching for inexact alignments of a read to a genome, Rockhopper identifies seed regions of the read that align exactly to the genome and then extends these seed alignments into longer inexact alignments using a dynamic program. The Minimum seed length parameter specifies the minimum seed length, i.e., the minimum number of consecutive nucleotides aligning to the genome exactly, as a percentage of the read length.
- Identify transcript boundaries. To speed up computation, the user can elect to analyze only annotated genes and forego identification of transcription start and stop sites as well as detection of novel transcripts.
- Predict operons. To speed up computation, the user can elect to forego the process of operon prediction.
- Minimum expression of UTRs and ncRNAs. Transcription start and stop sites are only identified for genes with expression above a certain level. The Minimum expression of UTRs and ncRNAs parameter specifies the minimum level of expression of a gene in order for identification of transcription start and stop sites. A lower value will lead to a larger number of UTR identifications (increased sensitivity and decreased specificity). A higher value will lead to a smaller number of UTR identifications (decreased sensitivity and increased specificity). Similarly, the parameter specifies a minimum expression level necessary for Rockhopper to identify a novel transcript. A lower value will lead to a larger number of novel transcript identifications (increased sensitivity and decreased specificity). Minimum expression levels are computed as a function of this parameter and of the average number of reads mapping to each nucleotide in the genome in a given experiment.
- Min reads mapping to a transcript. A de novo assembled candidate transcript is only retained in the final set of high quality transcripts if at least a certain number of sequencing reads, specified by this parameter, map perfectly to the candidate transcript.
- Minimum transcript length. Only de novo assembled transcripts of at least the specified length (in nucleotides) are retained.
- Min count to seed a transcript. When assembling transcripts from a constructed de Bruijn graph, we only begin assembly of a new candidate transcript from a node in the graph if at least the specified number of k-mers from the sequencing reads correspond to the node.
- Min count to extend a transcript. When assembling transcripts from a constructed de Bruijn graph, we only extend (i.e., continue assembly) of a candiate transcript from a node in the graph if at least the specified number of k-mers from the sequencing reads correspond to the extension (i.e., the subsequent node).
- Defaults button. Restores all parameters to their default values.
- Save button. Saves changes made to parameter values.
- Visualizing results in a genome browser
- IGV window
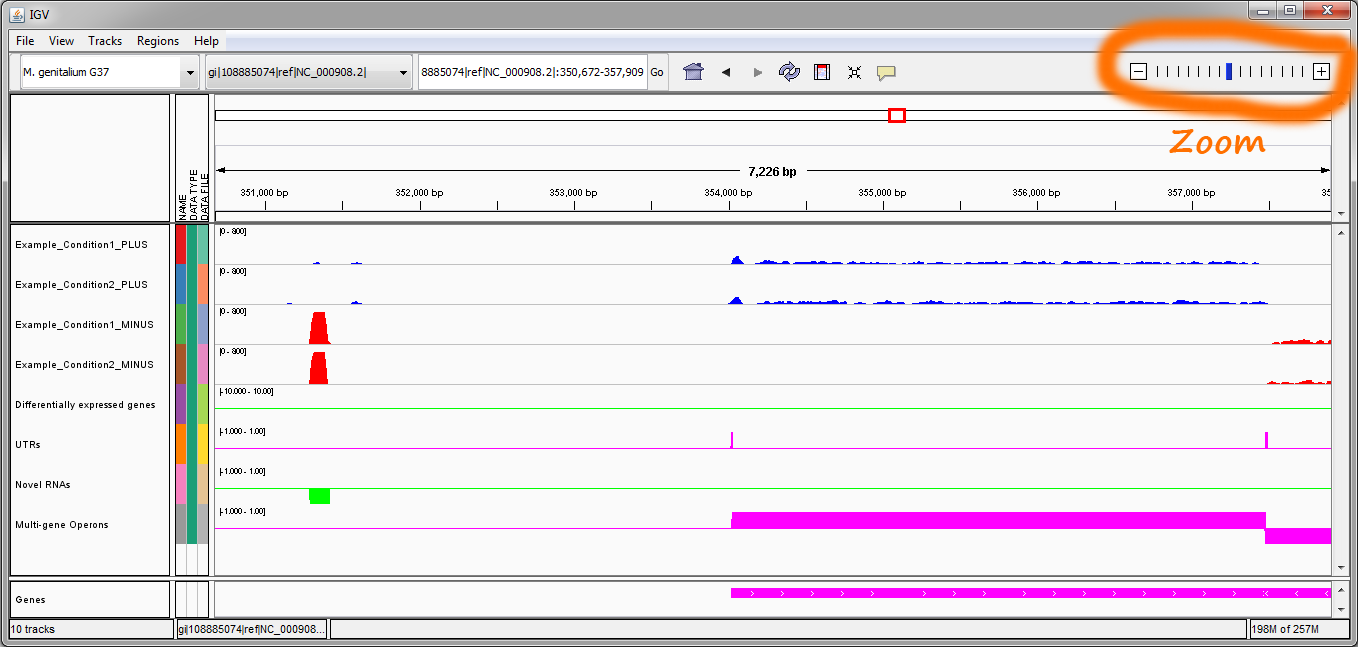
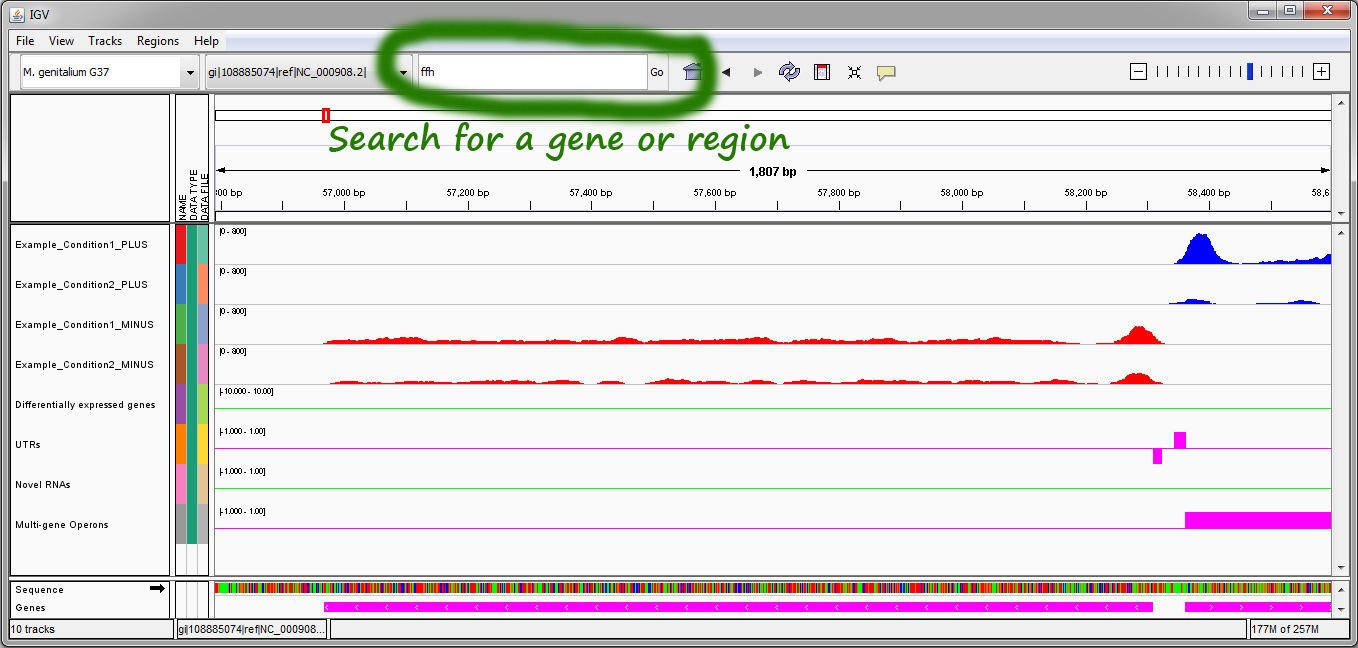
- Navigating the replicon. The top right corner has buttons that enable zooming in and out of the replicon. Clicking and dragging the mouse over any region of the replicon allows left and right navigation. Hovering the mouse over any gene in the bottom purple track will display information about the gene. Searching for particular genes or regions is possible using the search box and "Go" button in the top center of the IGV window.
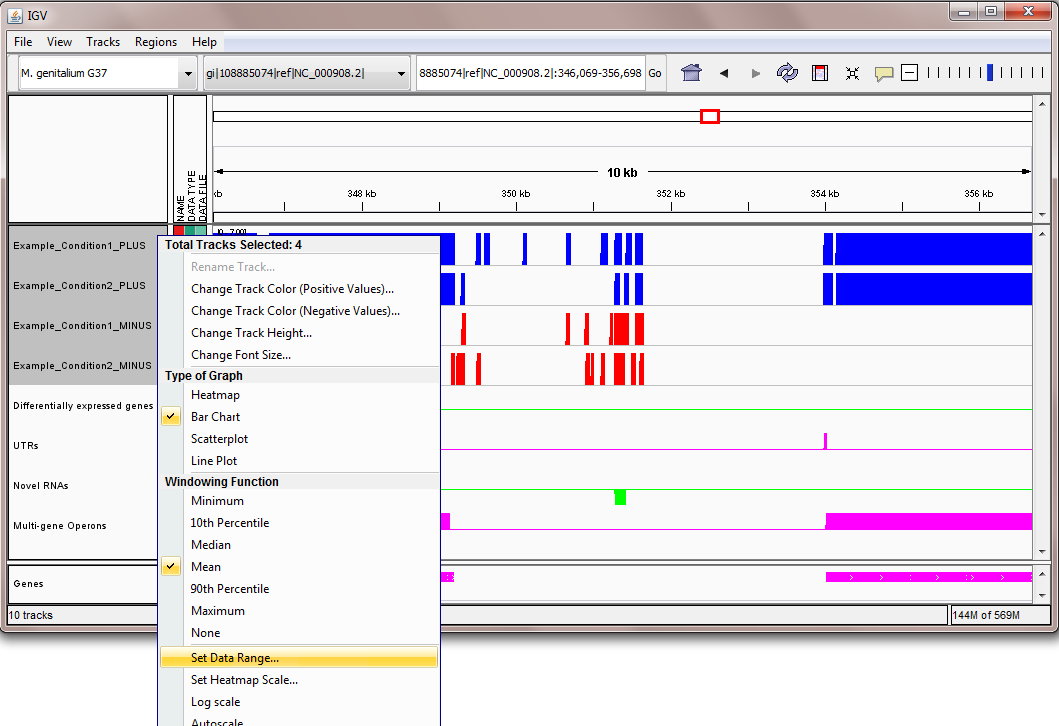
- Scaling the data. The scale on the sequencing reads tracks can be set by right clicking on the tracks, selecting "Set Data Range..." from the pop-up menu, and setting the maximum of the range as desired, as shown here.
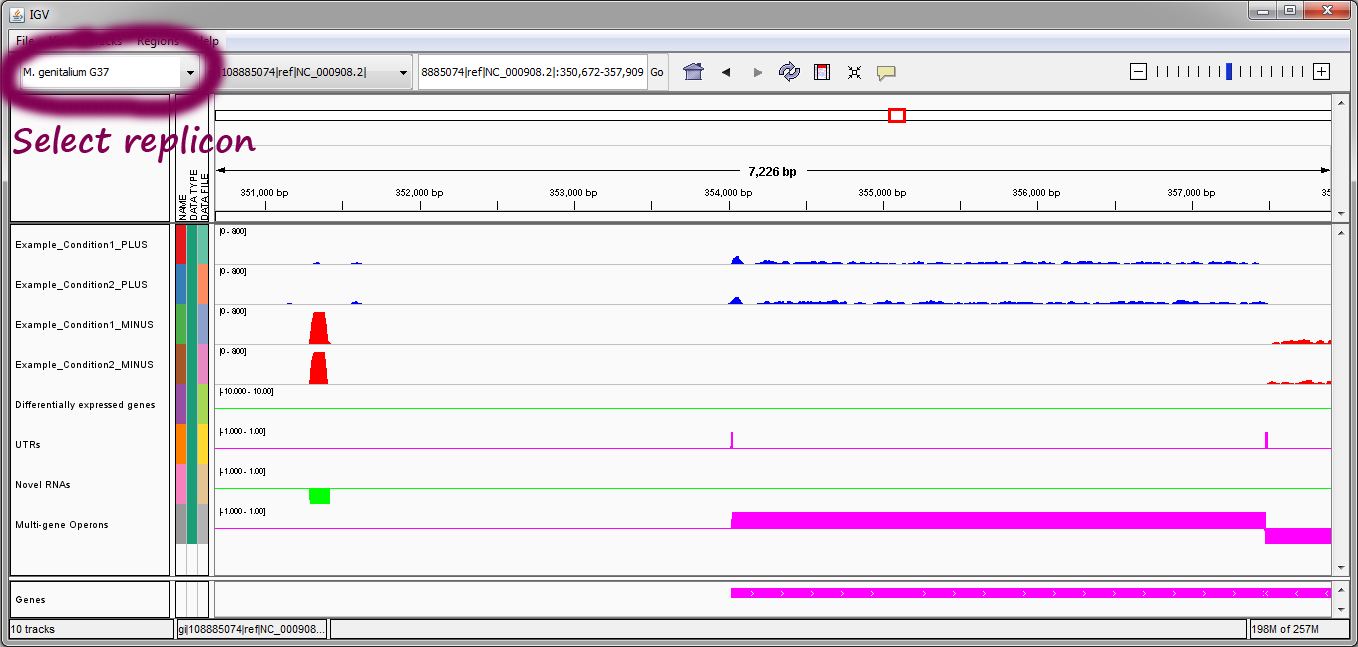
- Viewing multiple replicons. If reads were aligned to multiple replicons, the drop-down menu in the top left corner of the IGV window allows switching between the different replicons. Once a replicon is selected, the RNA-seq data must be loaded into IGV, which can be accomplished by going to the File menu and selecting Run Batch Script... and selecting the batch_*.txt file of interest from the folder Rockhopper_Results/intermediary.
Instructions for obtaining Rockhopper are available on the download page.
To begin using Rockhopper, follow the instructions
on the download page
for ensuring that you have Java on your computer
and for downloading Rockhopper. Once you have
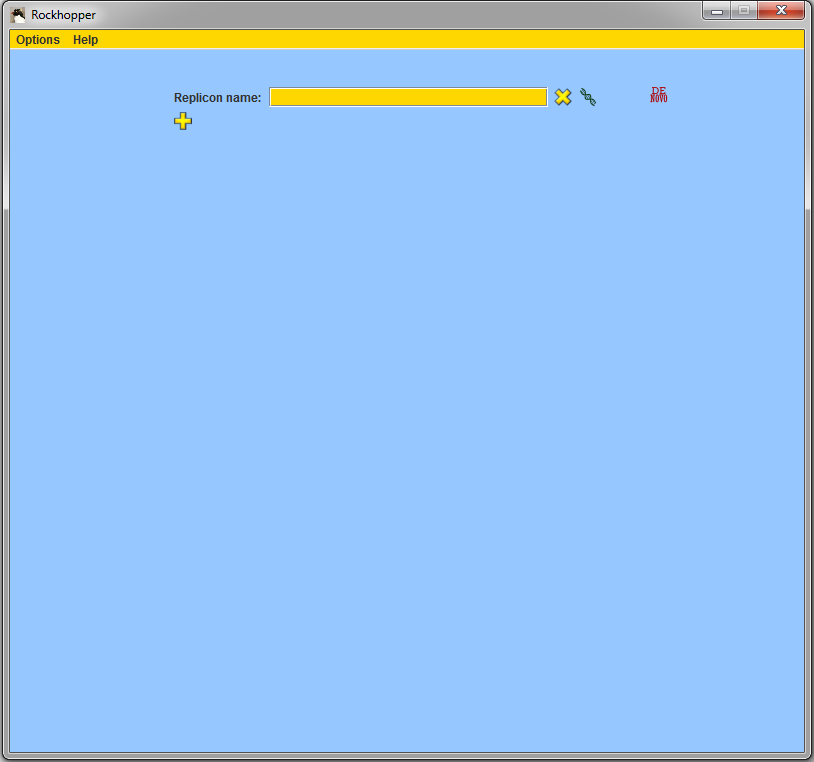
downloaded and started Rockhopper, you should see
a window such as that shown below:
When started, Rockhopper creates a folder named "Rockhopper_Results" where it stores both intermediary files as well as any output files that it computes.
In order to use Rockhopper, you need one or more files of RNA sequencing reads that you are interested in analyzing. Files should be in FASTQ or QSEQ or FASTA or SAM or BAM format. FASTQ/QSEQ/FASTA files optionally may be gzipped. If you wish to try out Rockhopper with a small example data set, we provide examples below both for reference based analysis (when one or more reference genomes are available) and for de novo analysis (when reference genomes are unavailable).
To test out Rockhopper on small example data sets,
you can download the two
files below, which contain sequencing reads
(a mere 137,000 reads per file) corresponding to
simulated transcripts from the Mycoplasma genitalium
G37 genome.
| Example_Condition1.fastq (17 MB) | Example_Condition2.fastq (17 MB) |
In the "Replicon name" field of the main window, begin
typing in the name
of your replicon of interest and when a pop-up list
appears, select your replicon from the list. Use the
yellow buttons, ![]() and
and ![]() , to add
and remove replicons if your genome of interest has more than one
chromosome or plasmid. If you are using the two example files
from above, then Mycoplasma genitalium G37 should
be entered in the "Replicon name" field.
, to add
and remove replicons if your genome of interest has more than one
chromosome or plasmid. If you are using the two example files
from above, then Mycoplasma genitalium G37 should
be entered in the "Replicon name" field.
Use the red buttons, ![]() and
and
![]() ,
to add and remove experimental conditions.
Use the blue buttons,
,
to add and remove experimental conditions.
Use the blue buttons, ![]() and
and
![]() ,
to add and remove biological replicates for a given
experimental condition.
Use the browse buttons,
,
to add and remove biological replicates for a given
experimental condition.
Use the browse buttons, ![]() ,
to select files of sequencing reads that you wish to analyze.
If you are using the two example files from above, then you
should select two experiments with one replicate each and, using
the browse buttons, you should fill in the names of the two
example files of sequencing reads for Mycoplasma genitalium G37.
,
to select files of sequencing reads that you wish to analyze.
If you are using the two example files from above, then you
should select two experiments with one replicate each and, using
the browse buttons, you should fill in the names of the two
example files of sequencing reads for Mycoplasma genitalium G37.
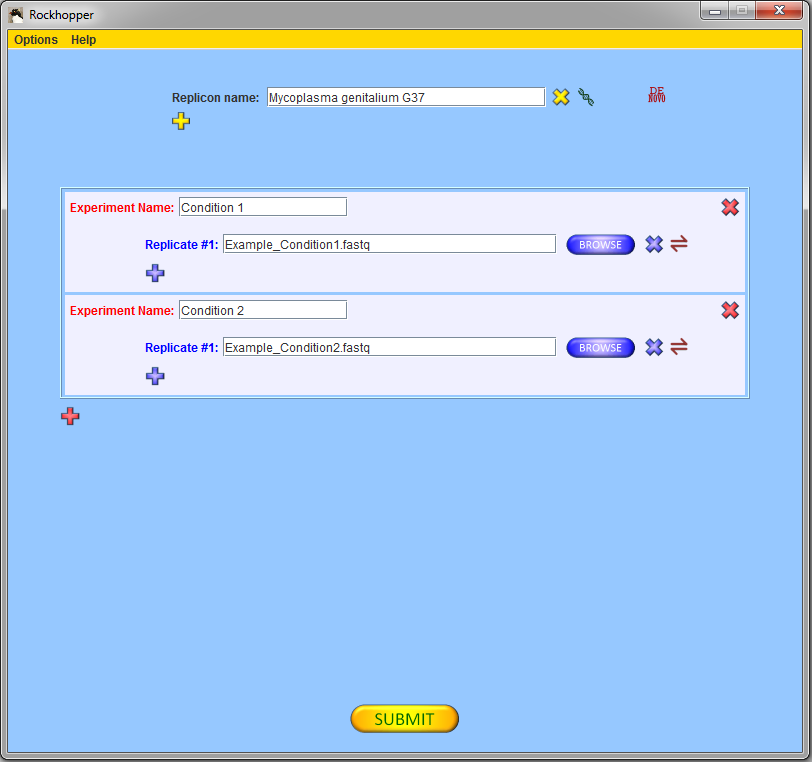
Press the submit button, ![]() ,
to submit your files for analysis.
It may take several minutes
for Rockhopper to align the reads to the genome, depending on the
number of reads, the length of the reads, the size of the genome,
and the speed of your computer's processors. Rockhopper automatically detects
the number of processors in your computer and uses all available
processors to speed up execution.
,
to submit your files for analysis.
It may take several minutes
for Rockhopper to align the reads to the genome, depending on the
number of reads, the length of the reads, the size of the genome,
and the speed of your computer's processors. Rockhopper automatically detects
the number of processors in your computer and uses all available
processors to speed up execution.
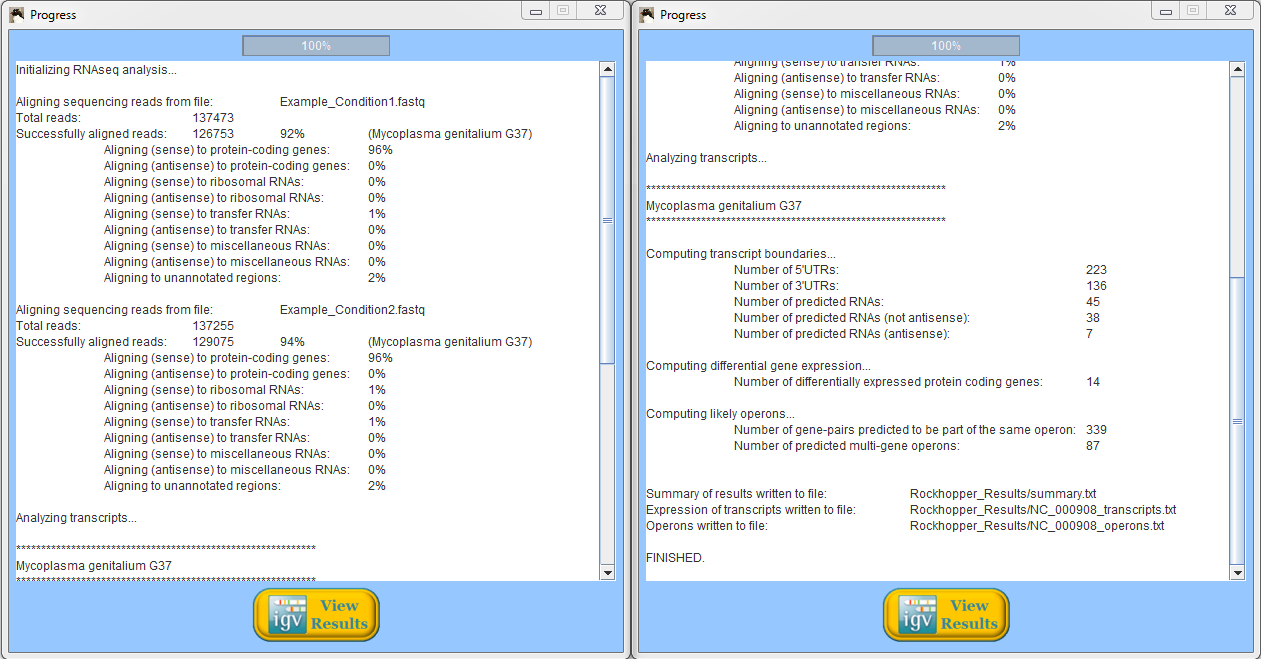
When Rockhopper completes execution, a summary of results is displayed. In the example above using reads from two simulated experiments with Mycoplasma genitalium, Rockhopper aligned 92% of the reads to the genome for one experiment and 94% of the reads for the other experiment. In the simulated Mycoplasma genitalium data, the distribution of reads aligning to annotated protein-coding genes, rRNAs, and tRNAs is not representative of what would be expected from a real (non-synthetic) RNA-seq experiment. All results of Rockhopper's analysis are available in text files in the folder "Rockhopper_Results". In the case of the example above, three text files are created in the folder "Rockhopper_Results":
In addition to the text files output by Rockhopper, results
can be viewed in the
IGV genome browser
by clicking the View Results button,
![]() .
The results of analyzing the two small example data sets provided above
are shown in the image below:
.
The results of analyzing the two small example data sets provided above
are shown in the image below:
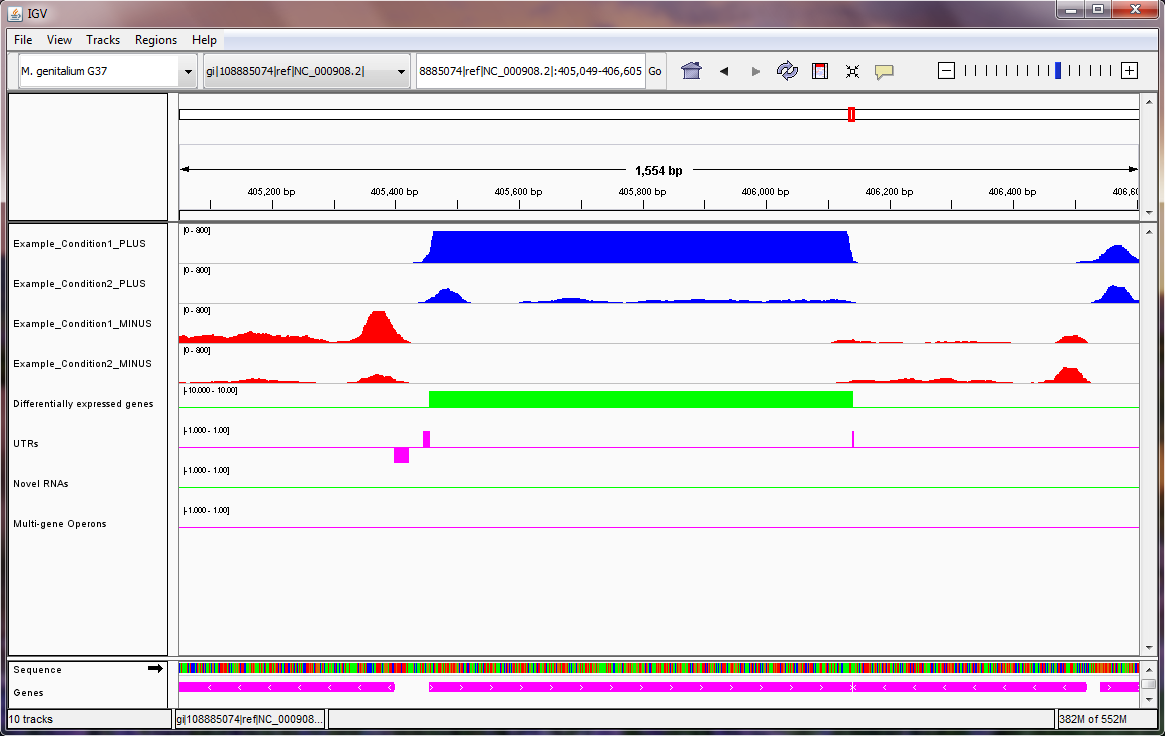
Note: in the Mycoplasma genitalium example above, we suggest setting the scale on the sequencing read tracks by right clicking on the tracks, selecting "Set Data Range..." from the pop-up menu, and setting the maximum of the range to be 800, as shown here. In the image above, the two blue tracks correspond to sequencing reads in the two experiments that Rockhopper aligned to the plus strand of the genome, and the two red tracks correspond to sequencing reads in the two experiments that Rockhopper aligned to the minus strand of the genome. The first green track corresponds to differentially expressed genes, with height of green bars indicative of significance of differential expression. There is one gene on the plus strand identified by Rockhopper as differentially expressed in the displayed region. The first purple track corresponds to UTRs of protein coding genes, as identified by Rockhopper. There are three UTRs in the displayed region, two on the plus strand and one on the minus strand. The first UTR (farthest left) corresponds to a 5'UTR for a gene on the minus strand, the second UTR corresponds to a 5'UTR for a gene on the plus strand, and the third UTR (farthest right) corresponds to a short 3'UTR for the same gene on the plus strand. The second green track corresponds to novel RNA transcripts. There are no novel RNA transcripts in the displayed region. The second purple track corresponds to multi-gene operons identified by Rockhopper. There are no multi-gene operons in the displayed region The final purple track at the bottom of the image corresponds to protein coding genes and RNA genes annotated in RefSeq.
When sequencing reads cannot be aligned to a genome because
no reference genome is available, Rockhopper performs
de novo transcript assembly as part of its analysis.
To test out Rockhopper's de novo analysis on a small
example data set, you can download the
gzipped FASTQ file below, which contains (a mere 360,000) sequencing reads.
| Example_denovo.fastq.gz (23 MB) |
We will have Rockhopper use the reads in the above file to assemble transcripts. In truth, the sequencing reads are derived from transcripts corresponding to the first 50,000 nucleotides of the Escherichia coli K-12 MG1655 genome. However, to test Rockhopper's de novo analysis, we will not align the reads to the E. coli genome and instead use the reads to assemble transcripts without using a reference genome.
To begin, press the red "DE NOVO" button,
![]() , in the top
right corner of the main window. This button controls whether
Rockhopper will perform de novo assembly of transcripts
or reference based assembly of transcripts.
, in the top
right corner of the main window. This button controls whether
Rockhopper will perform de novo assembly of transcripts
or reference based assembly of transcripts.
Use the red buttons, ![]() and
and
![]() ,
to add and remove experimental conditions.
Use the blue buttons,
,
to add and remove experimental conditions.
Use the blue buttons, ![]() and
and
![]() ,
to add and remove biological replicates for a given
experimental condition.
Use the browse buttons,
,
to add and remove biological replicates for a given
experimental condition.
Use the browse buttons, ![]() ,
to select files of sequencing reads that you wish to analyze.
If you are using the example file from above, then you
should select one experiment with one replicate and, using
the browse button, you should fill in the name of the
example file of sequencing reads.
,
to select files of sequencing reads that you wish to analyze.
If you are using the example file from above, then you
should select one experiment with one replicate and, using
the browse button, you should fill in the name of the
example file of sequencing reads.
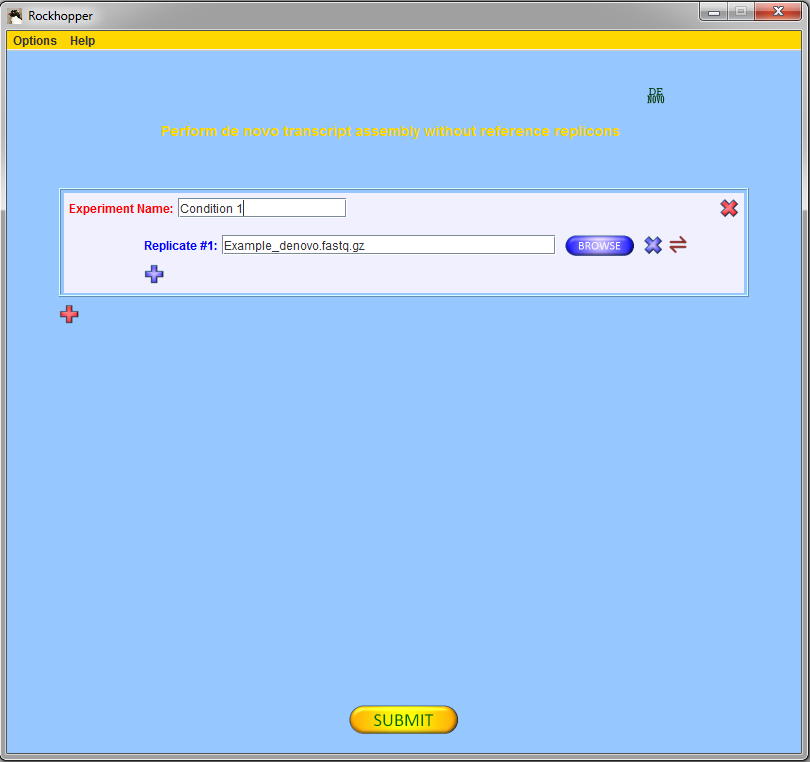
Press the submit button, ![]() ,
to submit your file for analysis.
It may take several minutes
for Rockhopper to assemble transcripts from the sequencing reads, depending on the
number of reads, the length of the reads,
and the speed of your computer's processors. Rockhopper automatically detects
the number of processors in your computer and uses all available
processors to speed up execution.
,
to submit your file for analysis.
It may take several minutes
for Rockhopper to assemble transcripts from the sequencing reads, depending on the
number of reads, the length of the reads,
and the speed of your computer's processors. Rockhopper automatically detects
the number of processors in your computer and uses all available
processors to speed up execution.
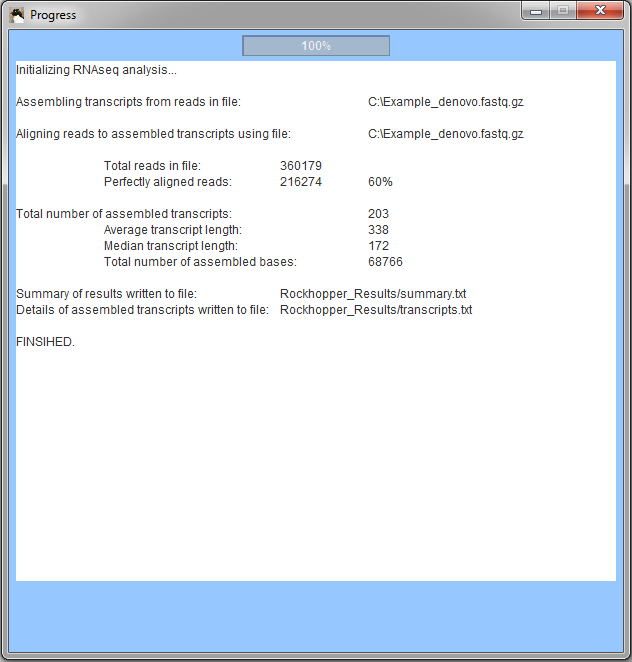
When Rockhopper completes execution, a summary of results is displayed. In the example, Rockhopper assembled transcripts from 360,000 sequencing reads. Approximately 216,000 of the reads align perfectly to one or more of the assembled transcripts (additional reads likely align imperfectly to the assembled transcripts). Rockhopper assembed 203 transcripts with an average length of 338 nucleotides and a median length of 172 nucleotides. The sum of the lengths of the 203 transcripts is 68,766 nucleotides. All results of Rockhopper's analysis are available in text files in the folder "Rockhopper_Results". In the case of the example above, two text files are created in the folder "Rockhopper_Results":
Rockhopper requires one or more files of RNA sequencing reads. Files should be in FASTQ or QSEQ or FASTA or SAM or BAM format. FASTQ/QSEQ/FASTA files optionally may be gzipped. Rockhopper automatically detects the format of any input files. Note, if using BAM files, your computer must use Java version 1.7 or later (earlier versions of Java contain a bug that causes BAM files to be processed improperly). If performing de novo transcript assembly, no further input files are used by Rockhopper. If performing reference based transcript assembly, then Rockhopper needs information about the reference genomes. When performing reference based transcript assembly, if genomic sequence information for the bacteria of interest is available from GenBank, then Rockhopper will automatically download the genome sequences and gene annotations so that these files do not need to be supplied by the user. If genomic sequence information for the bacteria of interest is not available from GenBank, then the user has the option of specifying a folder for each set of genome sequence and gene annotation files.
Execution of Rockhopper proceeds through a number of stages. A detailed description of the algorithms used by Rockhopper is provided in the manuscript Computational analysis of bacterial RNA-seq data. The stages of analysis are summarized below:
Reference based analysis
De novo analysis
Rockhopper outputs several text files of results. Text files are output to the folder "Rockhopper_Results".
Reference based analysis
De novo analysis
In the Options menu, the Parameter settings menu item will open a new window that will allow the user to customize various parameter values.
After completion of reference based analysis,
pressing the View Results button, ![]() ,
in the Progress window will cause results to be displayed in the
IGV genome browser.
When the IGV window opens, the first replicon should be loaded
automatically along with the aligned sequencing reads and the results of
Rockhopper's analysis. Blue tracks correspond to sequencing
reads aligned to the plus strand of the replicon and red tracks
correspond to sequencing reads aligned to the minus strand of
the replicon. The first green track corresponds to differentially
expressed genes, with height of green bars indicative of
significance of differential expression. The first purple track
corresponds to UTRs of protein coding genes, as identified
by Rockhopper. The second green track corresponds to novel
RNA transcripts. The second purple track corresponds to multi-gene
operons identified by Rockhopper. The final purple track at the
bottom of the image corresponds to protein coding genes and RNA
genes annotated in RefSeq. Below are two examples of Rockhopper
results displayed in IGV.
,
in the Progress window will cause results to be displayed in the
IGV genome browser.
When the IGV window opens, the first replicon should be loaded
automatically along with the aligned sequencing reads and the results of
Rockhopper's analysis. Blue tracks correspond to sequencing
reads aligned to the plus strand of the replicon and red tracks
correspond to sequencing reads aligned to the minus strand of
the replicon. The first green track corresponds to differentially
expressed genes, with height of green bars indicative of
significance of differential expression. The first purple track
corresponds to UTRs of protein coding genes, as identified
by Rockhopper. The second green track corresponds to novel
RNA transcripts. The second purple track corresponds to multi-gene
operons identified by Rockhopper. The final purple track at the
bottom of the image corresponds to protein coding genes and RNA
genes annotated in RefSeq. Below are two examples of Rockhopper
results displayed in IGV.
In the first example (image above), there is one differentially expressed gene on the plus strand. For this gene, both 5'UTR and 3'UTR regions have been detected by Rockhopper. Additionally, a 5'UTR region has been detected by Rockhopper for a gene on the minus strand. No novel RNAs or multi-gene operons have been identified by Rockhopper in the displayed region.
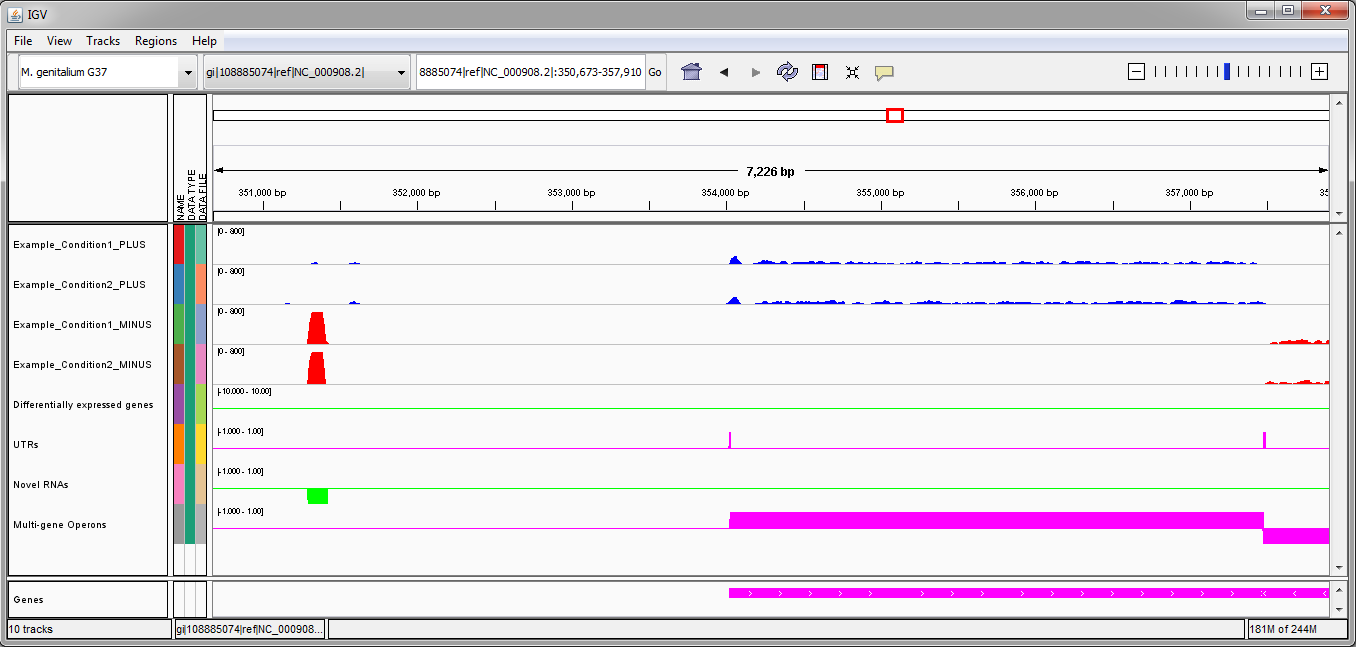
In the second example (image above), there is one novel RNA on the minus strand identified by Rockhopper. There is one multi-gene operon identified on the plus strand, with detected 5'UTR and 3'UTR. There is one multi-gene operon identified on the minus strand, though the operon extends off the image on the right. No differentially expressed genes have been identified by Rockhopper in the displayed region.
For a complete description of using IGV, please consult the IGV User Guide.