
|
|
Assignment 6
|
|
Due: Thursday, April 11, by 5:00pm
You can turn in your assignment up until 5:00pm on 4/11/19. You should hand in both a hardcopy
and electronic copy of your solutions. Your hardcopy submission should include printouts of two code
files, drawGUI.m and musicGUI.m, and a hardcopy of a picture created with
the GUI sketchpad that you construct for Problem 1. To save paper, you can cut and paste your code
files into one file, but your electronic submission should contain the two separate files. Your
electronic submission is described in the section How to turn in this
assignment.
Reading
The following material is especially useful to review for this assignment: notes and examples from Lectures #14-16 and Labs #7-8. There is also extensive online documentation on the creation of graphical user interfaces with the GUIDE program available through the MATLAB Help facility.
Getting Started: Download assign6_problems
Use Cyberduck to connect to the CS server and download a copy of the assign6_problems
folder onto your Desktop. The assign6_problems folder contains one code file for Problem
1, setupCoords.m, and six code files for Problem 2:
testMusic.m, emptySong.m, addNote.m, displayNotes.m, displaySignal.m,
and playSong.m.
Uploading your completed work
When you have completed all of the work for this assignment, your assign6_problems
folder should contain 11 files: two .fig files, drawGUI.fig and
musicGUI.fig, and nine M-Files,
drawGUI.m, setupCoords.m, musicGUI.m, testMusic.m, emptySong.m, addNote.m, displayNotes.m,
displaySignal.m
, and playSong.m.
Use Cyberduck to connect to the CS file server and navigate to your
cs112/drop/assign06 folder. Drag your assign6_problems
folder to this drop folder. More details about this process
can be found on the webpage on Managing Assignment Work.
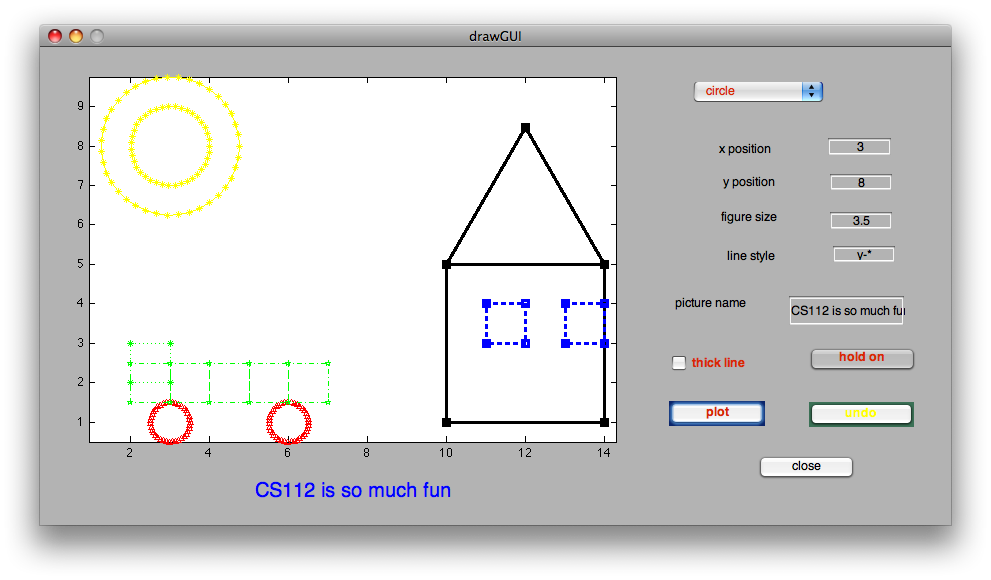
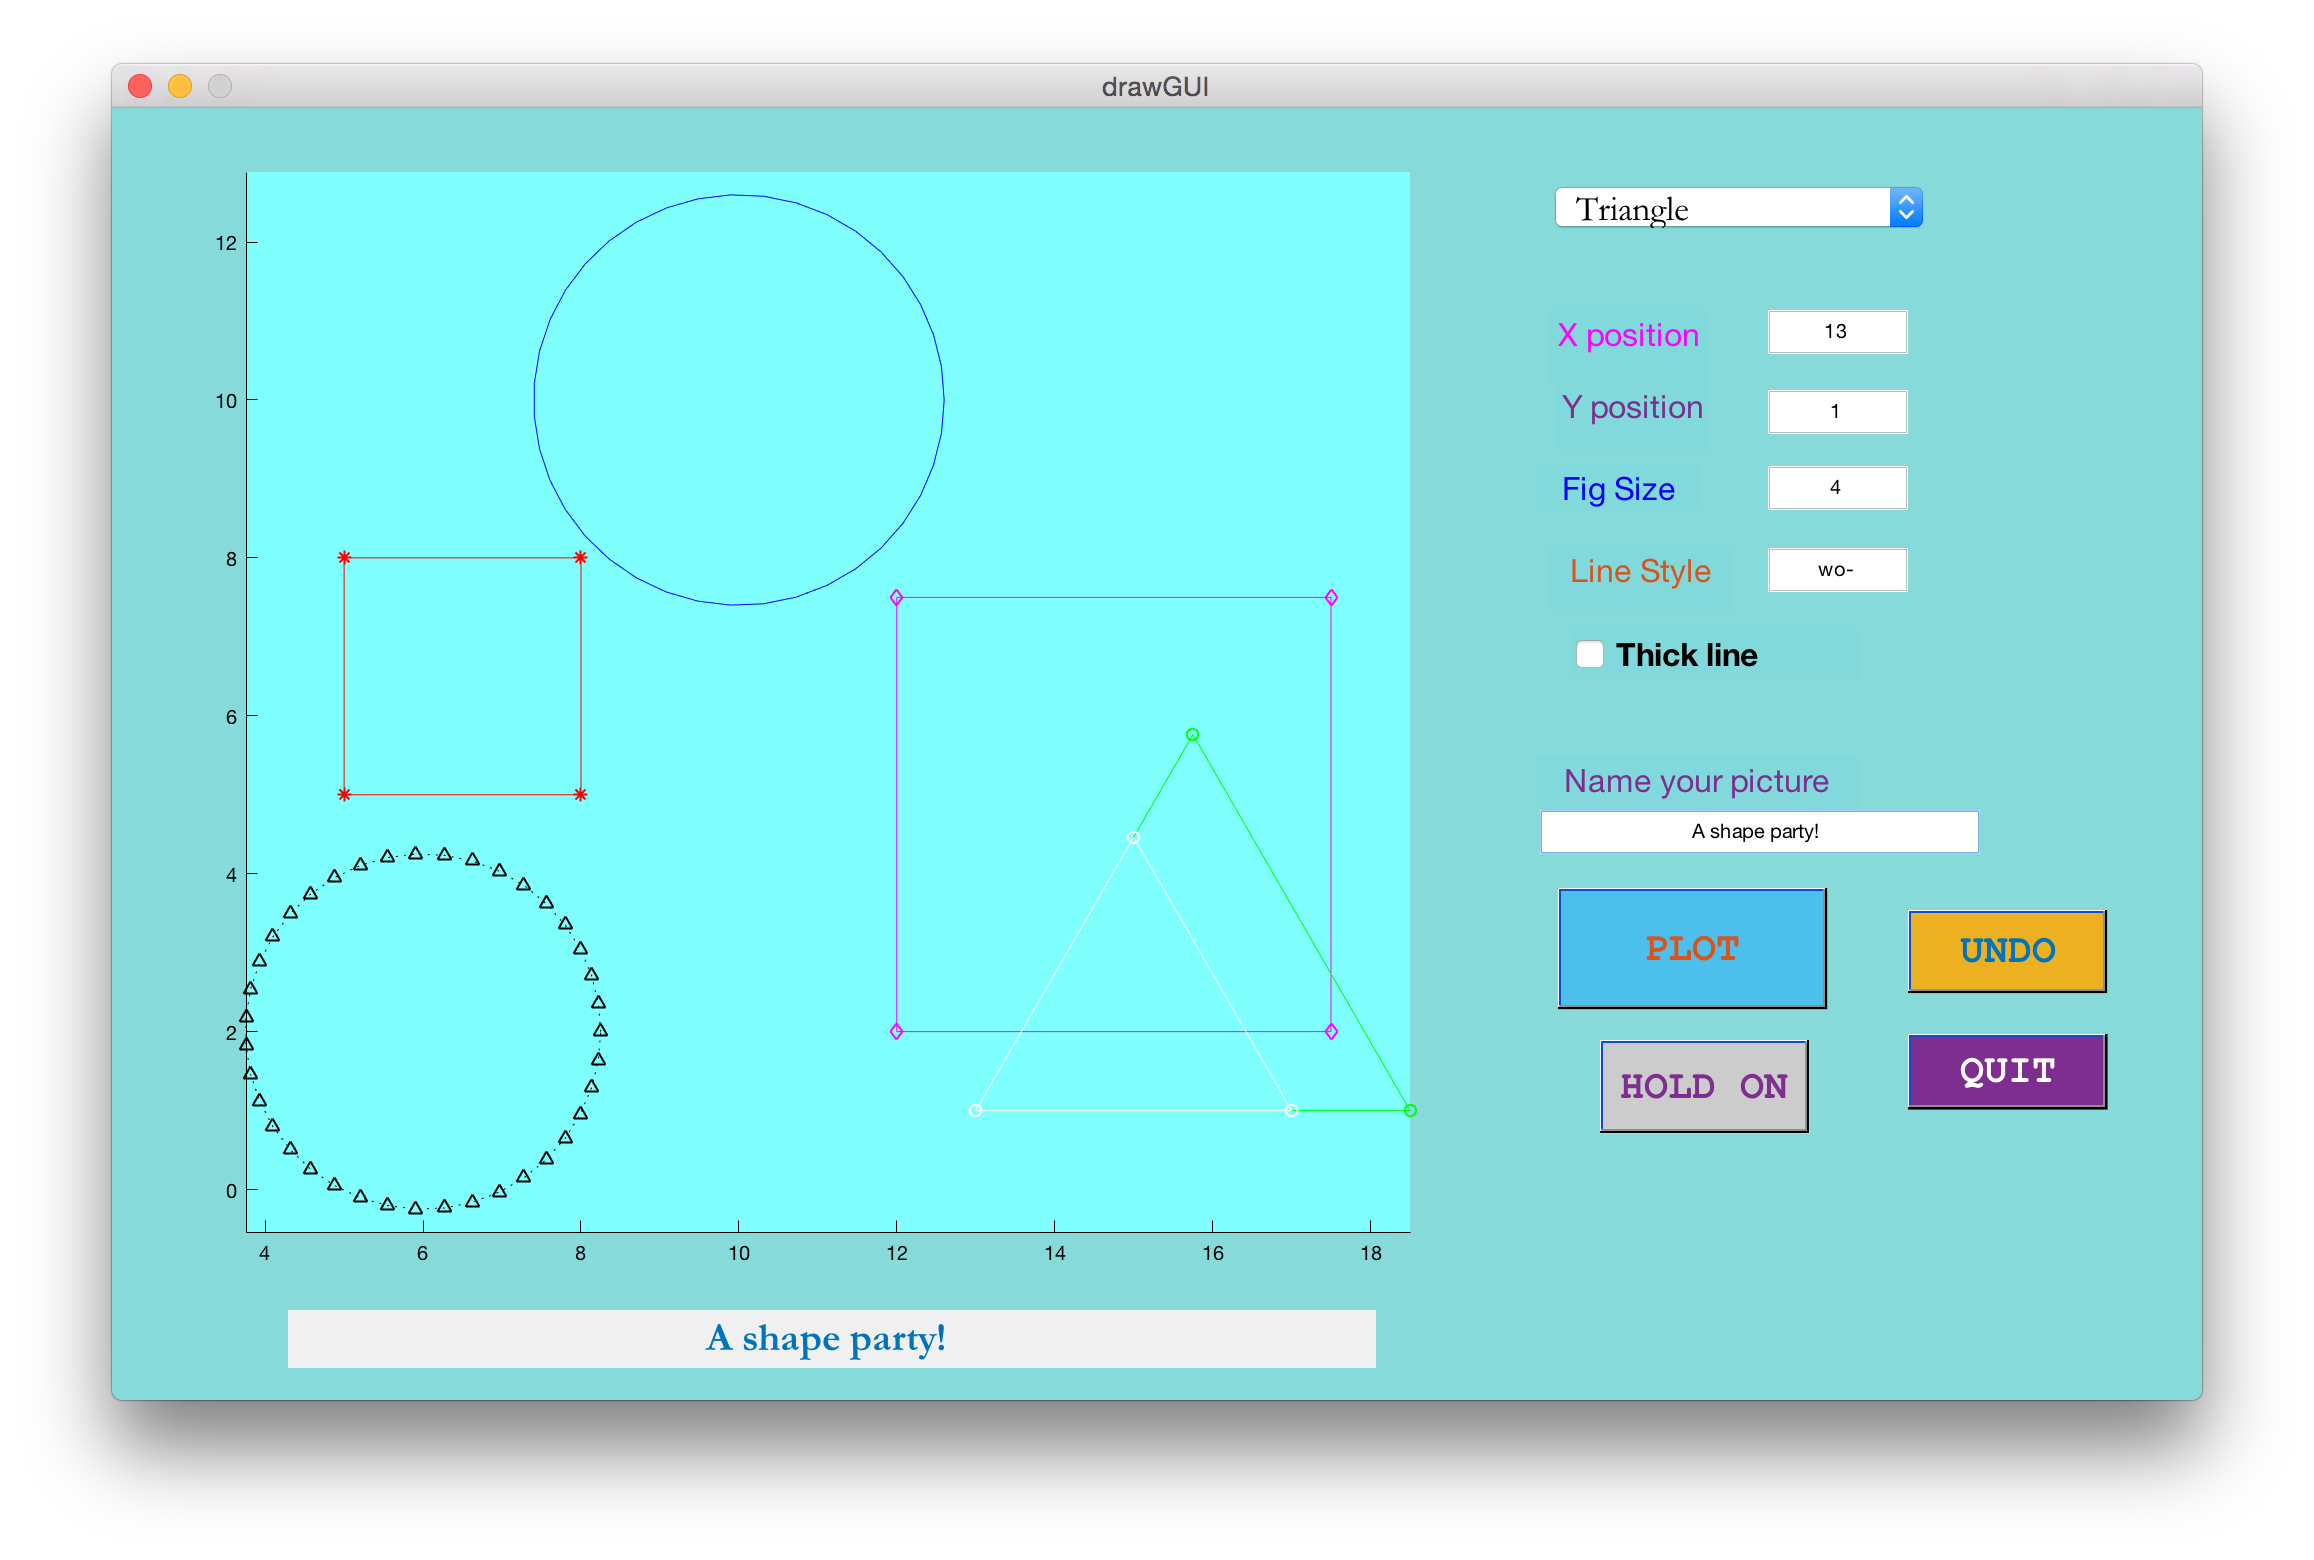
Problem 1: Create a GUI sketchpad
In this problem, you will build a GUI sketchpad that might look something like this when complete (two different versions are shown, you have creative freedom to design yours as you like, so long as all the components are present):
Part A: Using the Layout Editor to lay out your GUI
To begin, enter guide in the Command Window to start the Layout Editor
for the MATLAB Graphical User Interface Development Environment. A GUIDE Quick
Start window will appear with Blank GUI (Default) selected. Click
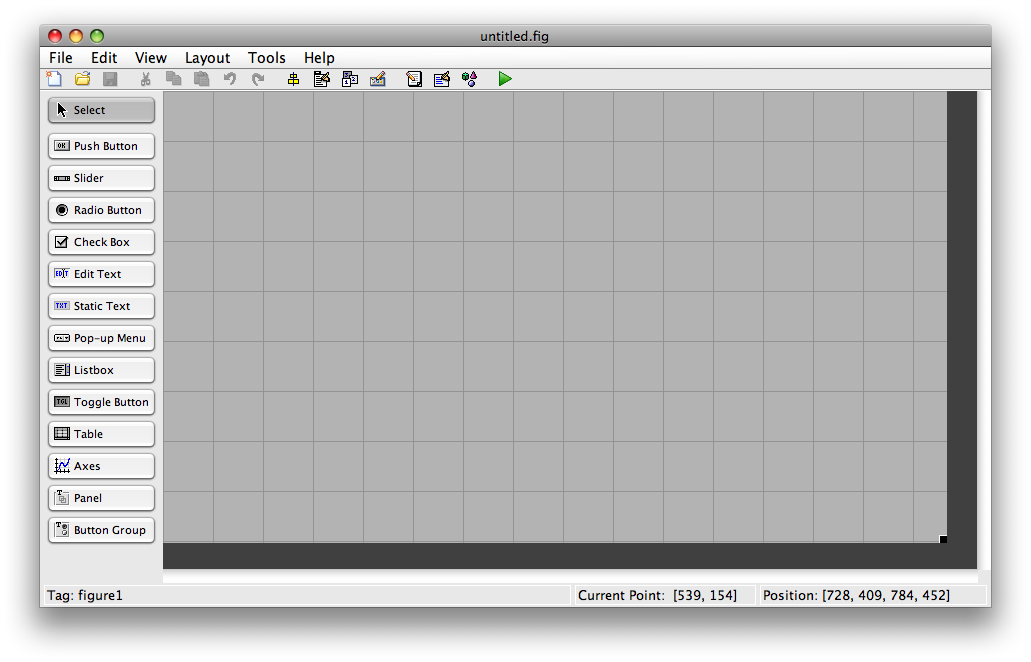
the OK button. A Layout Editor window will appear (image shown below), titled
untitled.fig (when you save your GUI for the first time, name it
drawGUI). Select Preferences... from the File menu, and in
the Preferences window, check the box labeled Show names in component
palette and click the OK button. You are now ready to create your GUI!
First, you're going to design the physical layout of your sketchpad, using the components listed below. The GUI images above are merely samples -- you are free to layout your own GUI as you wish.
-
Axes:drawing window -
Popup Menu: menu to select square, circle or triangle -
Edit Text: text boxes with labels where the user can enter the following information:
- x coordinate of position of new figure
- y coordinate of position of new figure
- size of new figure
- line style for new figure, e.g.
g:* - name of picture
-
Static Text: text label for picture name -
Checkbox: to set linewidth to 1 (if not checked) or 2 (if checked) -
Toggle Button: to specifyhold onorhold off -
Push Button: buttons for each of these actions:
- plot the new figure
- undo the last plot
- close the GUI
- drag and resize the component to the desired location and size
- double-click on the component to open the Property Inspector to set the
following properties for each component:
- the
Stringproperty specifies the text string that will appear on the component - the
Tagproperty specifies a name that will be used to refer to this component in your GUI code - (optional)
Color, BackgroundColor, ForegroundColor, FontName, FontSize, FontWeight
- the
- The
.mfile and.figfiles are intertwined:
When you add a new component to the.figfile, the.mis automatically updated to include the new component. - Resizing the whole GUI:
The entire GUI window can be resized by dragging the lower right corners of the full Layout Editor window and the inner layout grid. - Saving your work so far:
Click on the save icon (floppy disk) in the menu bar, or select Save from the File menu. TypedrawGUIas the file name. MATLAB will also save the Layout Editor figure as a.figfile, e.g.drawGUI.fig. - Saving and running your GUI:
Click on the green triangle (circled in red below) at the far right end of the menu bar.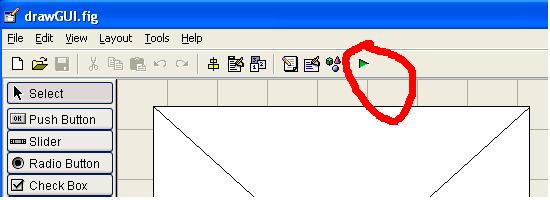
- Executing the current GUI file:
TypedrawGUIin the Command Window, or selecting Run from the Tools menu. - Revisiting this GUI later:
To return to this GUI in the Layout Editor at a later time, enterguide drawGUI.figin the Command Window
Part B: Writing MATLAB code to add functionality to your GUI components
Once you have your GUI components laid out, you can then modify the
drawGUI.m code file to perform actions in response to
each of the GUI components. Recall that MATLAB automatically generates
code for each GUI component in your drawGUI.m file. First, modify the
drawGUI_OpeningFcn function (executed when the GUI is
first created) by constructing fields of the handles
structure that store information that needs to be shared across GUI components:
- matrix of x,y coordinates for a square with side length 1
- matrix of x,y coordinates for a circle of diameter 1
- matrix of x,y coordinates for an equilateral triangle with side length 1
- vector to store the plots drawn so far (to support the undo operation)
To assist you with the matrices of coordinates for the three shapes, the function setupCoords is
provided in the setupCoords.m file. This function returns three matrices that contain
x,y coordinates for the square, circle, and triangle. The first row of each matrix contains the
x coordinates and the second row contains the y coordinates. Examine the coordinates to understand
how the user's specified position and size will affect their appearance. In the drawGUI_OpeningFcn
function, the matrices returned by setupCoords can be placed directly into the
handles structure, similar to the setup of variables in the energyGUI
program discussed in lecture.
Your next step is to modify the Callback functions for the components that have an immediate visual effect in your GUI. For example, the plot button has an immediate effect when pressed in the GUI. For the other GUI components that do not have an immediate visual effect (e.g., x position, y position, etc), MATLAB automatically keeps track of the current values of the user-entered strings.
-
Edit Textcomponent for picture name: modify theStatic Textstring that appears below the drawing area, using the text that the user entered in theEdit Textbox. Remember that you have access to all of the GUI components through the inputhandlesstructure and can read and modify the state of these components with thesetandgetfunctions. -
Toggle Button: sethold onorhold off, depending on the state of this button, and also adjust the text string that appears on this button in the GUI display (similar to thesourceTogglein theenergyGUIprogram). -
Push Buttoncomponents: for the plot button, call theplotfunction to plot the selected figure (square, circle or triangle) in the drawing window, using the current settings for the x and y position, size, line style and linewidth. Note that theValueproperty for a checkbox is 0 when not checked and 1 when checked (the same is true of a toggle button). Also modify the field of thehandlesstructure that stores the vector of plots in the current display, in order to support the undo operation. For the undo button, delete the last plot drawn and update thehandlesstructure appropriately. For the close button, execute the following statement:delete(handles.figure1)
- Remember that every function that modifies the value of a field of the
handlesstructure must include the following statement at the end:guidata(hObject,handles) - Many Callback functions will remain empty, that is, no action will be
performed when the GUI components are used. The GUI component information (e.g. x position) is accessed by using the
handlesstructure from within the Callback function for theplotbutton. - You can also include printing statements by omitting the semi-colon at the end
of any statement that produces a value, or adding calls to the
dispfunction. These values will be printed in the Command Window.
Part C: I think my GUI is done, now what do I do?
Thoroughly test your GUI to make sure it really works.Nothing to undo?
Check your GUI in the following scenario. If your hold on button is clicked and you plot something, and then click undo, what you just drew should go away. Now, if you click undo again, but there is nothing to undo, a well-designed GUI would handle this scenario gracefully (i.e. without generating MATLAB error messages). Your GUI should handle this scenario gracefully.
View the whole drawing from the beginning
MATLAB's tendency is to show just what you plot and no more. When drawing in a sketchpad, it is often desirable to view the entire drawing canvas for the session. One way to do this is to create a rectangle that has the dimensions of your desired drawing (e.g. 12.5 x 9.25 in the above GUI), and draw that rectangle in white so it is invisible. This will initialize the plotting area to the specified dimensions. Of course, if the user plots something out of that canvas, (e.g. a bird at coordinates (20,20)), then MATLAB will automatically expand the canvas to include the new object.
Design a picture and print a hardcopy
Fully test your GUI by experimenting with many settings. When testing, remember that you should hit the return key after editing any text field of your GUI. When you are convinced your GUI is working well, construct a final picture to submit with your assignment. Print a hard copy of your final picture (see instructions below) to turn in with your assignment.
How to print a hard copy of your final picture in your sketchpad
Electronic submission
Be sure to include both the drawGUI.m and drawGUI.fig files
in the assign6_programs folder that you submit electronically.
Problem 2: Making Music with MATLAB 
In this problem, you'll create a GUI for a program that allows you to create, display and play a simple song in MATLAB. Much of the code for this program is provided for you. Your task is to create the GUI, which will contain some new GUI components: a listbox, radio buttons and a slider. Here is a sample GUI layout for the program:
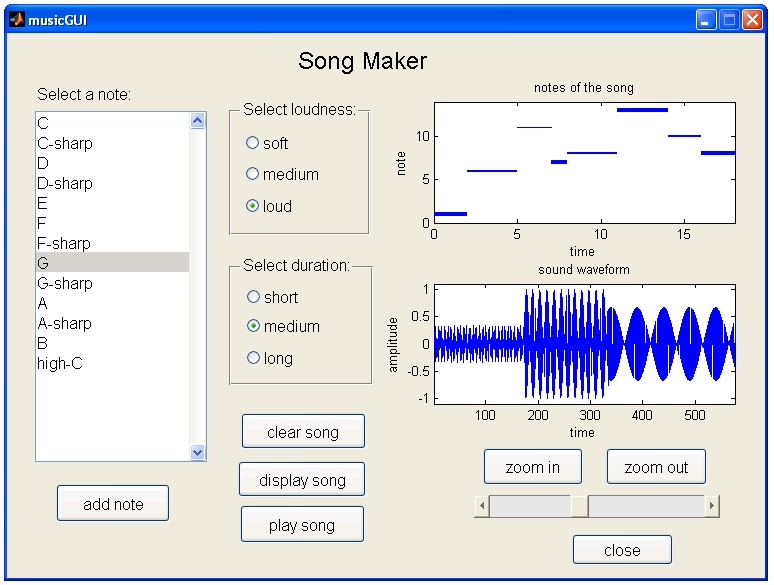
You're welcome to add your own style to the appearance of the GUI, which should contain the following components:
- a
Listboxthat contains a list of notes for the user to select the next note to add to the song -
Radio Buttonsfor the user to select a loudness and duration for each note, given three choices - two graphing
Axesto display the note sequence and sound waveform for the user's song - a
Sliderthat allows the user to shift the sound waveform to the left or right, to view different parts of the waveform - various
Push Buttonsto perform the following actions:- add a note to the song
- clear the song
- display the song (both the notes and waveform)
- play the song
- zoom in to see the waveform at a higher resolution
- zoom out to see the waveform at a lower resolution
- exit the program
There are six code files in the assign6_problems folder: a script file
named testMusic.m and five function files, playSong.m, displaySong.m,
displaySignal.m, addNote.m and emptySong.m.
You do not need to make any changes to these files. The functions
assume that the song is stored in a cell array that contains three
vectors: the first vector stores the notes (integers from 1 to 13 that represent the 13
notes listed on the GUI), the second vector stores the loudness of each note
(an integer from 1 to 3, representing soft, medium and loud) and the third vector stores
the duration of each note (an integer from 1 to 3, representing short, medium and long).
You do not need to write any code that refers to this cell array of vectors.
Your GUI code will just call the five functions, described below:
function song = emptySong

% returns an initial empty song
function newsong = addNote (oldsong, note, loudness,
duration)

% given an input song and input note (integer between 1 and 13),
loudness

% and duration (both integers between 1 and 3), returns a new song with

% the new note added to the end of the old song
function displayNotes (song)

% displays the notes of the input song - time is shown on the
horizontal

% axis and the notes (integers between 1 and 13) are shown on the vertical

% axis. Each note is displayed as a short segment whose length is the

% duration and width is the loudness of the note
function displaySignal (song, zoom, slider)

% displays the sound waveform for the input song, given an input
zoom factor

% (integer greater than or equal to zero) that controls how stretched out the

% signal is on the horizontal time axis, and input slider value (number between

% 0 and 1) that controls which segment of the sound waveform is shown
function playSong (song)

% plays the input song
To illustrate how these functions are called, the script testMusic.m
creates a song that consists of the 13 notes of the scale in ascending order with
varying loudness and durations, displays the notes and the sound waveform for two
different zoom factors 0 and 10, and then plays the song.
Tips on creating the GUI layout with GUIDE
- Multiple strings for a
Listboxcan be entered in the Property Inspector in the same way as strings for aPop-up Menu. - To create the radio buttons, first drag a
Button Grouponto the GUI and then drag the individualRadio Buttonsto their location inside theButton Groupbox on the GUI. TheTitleproperty for theButton Groupcontrols the string that appears at the top of the box on the GUI (e.g. "Select loudness" on the GUI displayed above). The radio buttons each have aValueproperty that is 0 or 1 depending on whether the button is selected. Be sure to specify a uniqueTagname for each radio button. - A
Sliderhas aPositionproperty that is a vector of four values that specify (1) distance from the left edge of the GUI window, (2) distance from the bottom of the window, (3) width and (4) height. If the width is greater than the height, the slider will be oriented horizontally. TheSliderhas aValueproperty that is a number between 0 and 1, which can be provided directly as an input to thedisplaySignalfunction. - You do not need to create labels for the two graphing areas - these labels are displayed
by the
displayNotesanddisplaySignalfunctions using thetitlefunction.
In the GUI opening function, create two variables in the handles structure
to store the current song (this can be initialized to the empty song that is returned by
the emptySong function) and the zoom factor (initialized to 0).
Guidelines on the GUI behavior
- When the "add note" button is pressed, a new note should be added to the current
song using the user's selected note, loudness and duration. After getting this information
from the GUI, the
addNotefunction can be called to add the new note. The displays of the notes and sound waveform do not need to be updated at this point. - When the "display song" button is pressed, both the notes and sound waveform should
be displayed. The
axesfunction can be used to specify where to display the notes and signal. - When the "zoom in" button is pressed, the zoom factor should be incremented by 1,
and when the "zoom out" button is pressed, the zoom factor should be decremented by 1 (be
sure the zoom factor does not become negative). When the "zoom in" or "zoom out" buttons
are pressed or the slider is modified, the display of the sound waveform should be updated
by calling the
displaySignalfunction. Note that when the sound waveform is displayed for a zoom factor of 0, the full waveform is displayed and the slider does not shift the waveform. - When the "play song" button is pressed, the user should hear their song played.
- When the "clear song" button is pressed, the current song should be reset to an initial empty song.
- Clicking on the "close" button should close the GUI window and terminate the program.
How to turn in this assignment
Step 1. Complete
this online form.
The form asks you to estimate your time spent on the problems. We use this information to help us design
assignments for future versions of CS112. Completing the form is a requirement of submitting the assignment.
Step 2. Upload your final programs to the CS server.
When you have completed all of the work for this assignment, your assign6_problems
folder should contain 11 files: two .fig files, drawGUI.fig and
musicGUI.fig, and nine M-Files,
drawGUI.m, setupCoords.m, musicGUI.m, testMusic.m, emptySong.m, addNote.m, displayNotes.m,
displaySignal.m
, and playSong.m. Use Cyberduck to connect
to your personal account on the server and navigate to your cs112/drop/assign06 folder.
Drag your assign6_problems folder to this drop
folder. More details about this process can be found on the webpage on
Managing Assignment Work.
Step 3. Hardcopy submission.
Your hardcopy submission should include printouts of two code files, drawGUI.m and
musicGUI.m, and a hardcopy of a picture created with the GUI sketchpad that you construct
for Problem 1. To save paper, you can cut and paste your code files into one file, and you only need to
submit one hardcopy for you and your partner. If you cannot submit your hardcopy in class on the due
date, please slide it under Ellen's office door.