CS112:: 3D visualization and working with recursion
Plotting 3D surfaces
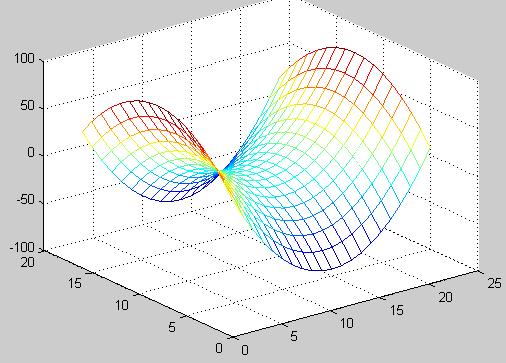
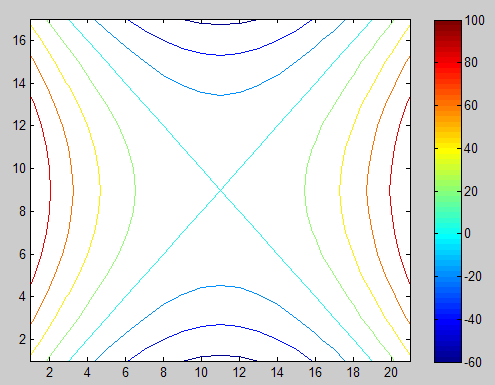
Sometimes it is useful to plot 3D surfaces.
Here is an example of a simple mathematical equation.
z = x2 - y2
How to plot this equation:
- Create two vectors, say -10<=x<=10 and -8<=y<=8.
- Create two new vectors that contain the squares of the
x and
y vectors from Step 1.
- Use
meshgrid to create matrices of all the x squared and y squared values
in proper orientation.
The effect of meshgrid is to create a matrix X with the x-values along each row, and a matrix Y with the y-values along each column. This is done so that it is easy to evaluate a function z=f(x,y) of two variables on the rectangular grid. Click here for an example of how meshgrid works.
- Create the matrix Z in terms of X and Y (where Z(i,j) = X(i)^2 - Y(j)^2)
Changing viewpoint
MATLAB tracks
view using azimuth and elevation.
azimuth is a polar angle in the x-y plane, with positive angles indicating
counterclockwise rotation of the viewpoint (see diagram below). You can think of it as the horizontal
rotation about the z-axis, as measured in degrees from the negative y-axis.
Elevation is the angle above (positive angle) or below (negative angle) the x-y plane.
You can see it as the vertical elevation of the viewpoint in degrees

Here is an example of viewing an object from directly overhead:
az = 0;

el = 90;

view(az, el);
Click here for an assortment of general 2D and 3D plotting examples.
Recursion
In this problem we will review recursion and write a couple of recursive MATLAB functions.
- Write a function called power()to compute
x^n, according to the following
recursive definition:
|
x^0 = 1.0
|
for all x
|
|
x^n = x * x^(n-1)
|
for n>0
|
Test your function.
- Write one more function, called morePower(),
to compute x^n according to the following definition:
|
x^n = x^(n/2) * x^(n/2)
|
for even n values
|
|
x^n = x * x^(n/2) * x^(n/2)
|
for odd n values
|
Test your morePower()
function.
-
Write a function that takes a string as input, and returns true if the input string consists
only of capital (english) letters, false otherwise. Test your function.
-
Define a function,
capitalize(), that takes a string as input, and returns it with all letters in capital case.
Here is the link to your cs112 assignment:
Assignment 8