
Documentation: MATLAB extras
This document describes some additional MATLAB background and examples that may be useful for your final projects, illustrating the following topics:
Displaying Images and Graphics in Apps
Selecting a File for Reading or Writing with uigetfile and uiputfile
Adding Buttons to a Radio Button Group
Changing the Text in GUI Components
Tips on Working with Excel Spreadsheets
Code and other files for these examples can be found in the
MATLAB_extras folder in the CS112 download directory
(also in this zip file).
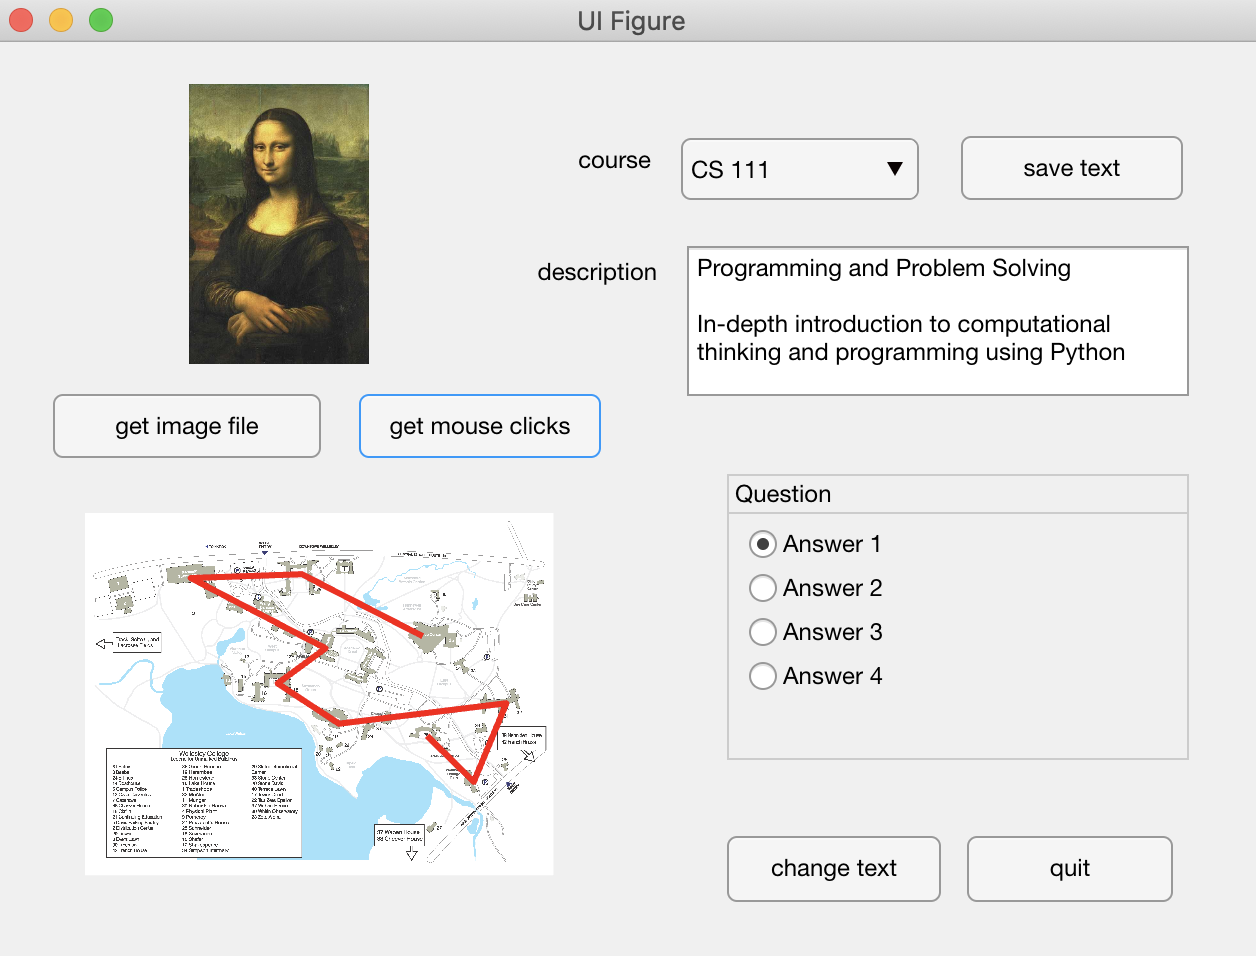
There is an App named extrasApp created with App Designer that can
be executed to demonstrate many of these examples. When you run this App, the
following motley display of GUI components will appear:
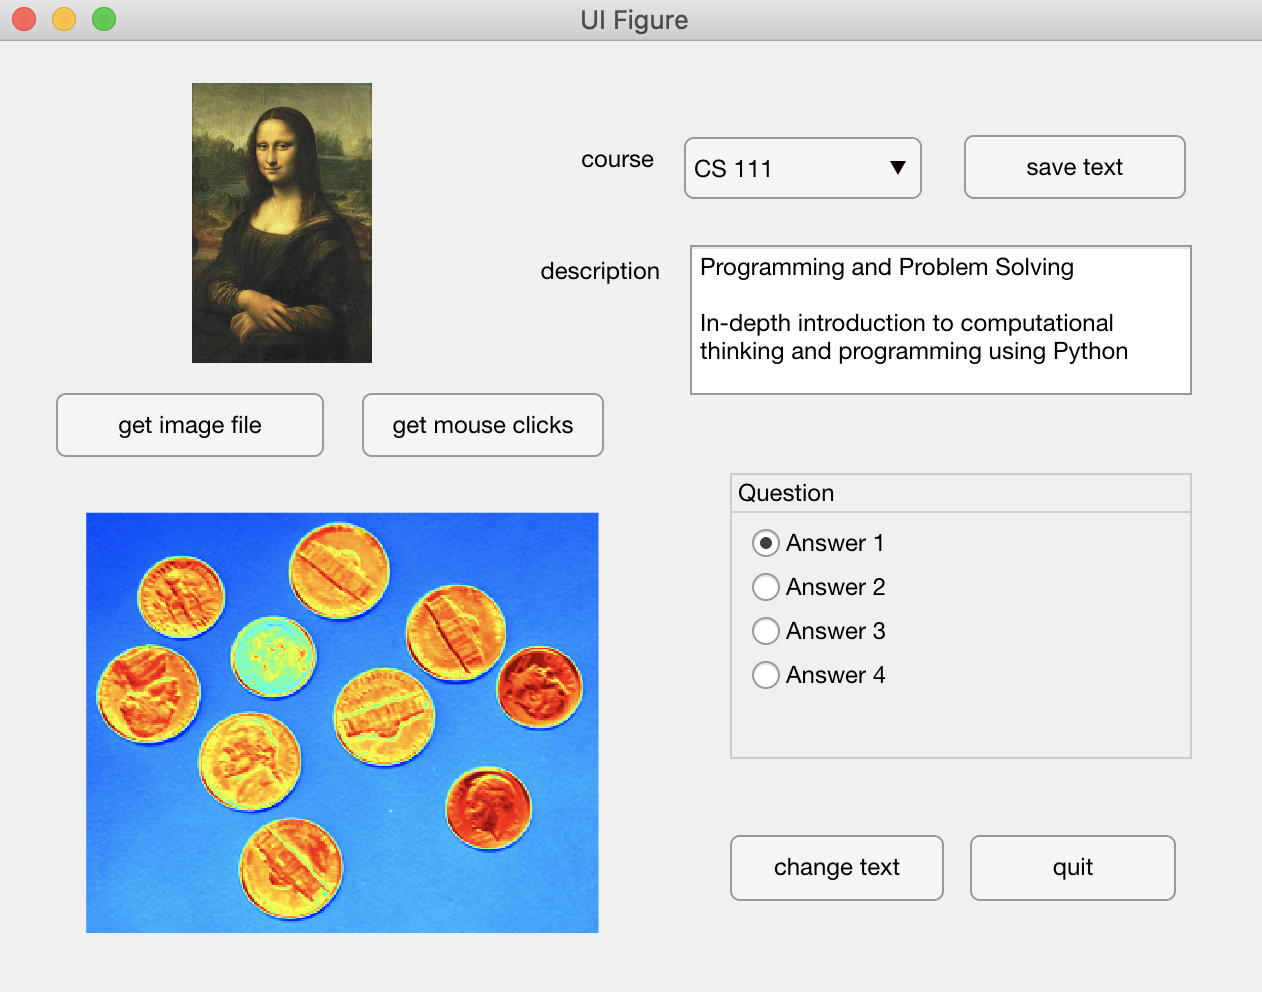
The actions of the various GUI components are described in the sections below. The MATLAB Help facility provides further documentation for the functions described here.
App Startup Function
The Figure window for an App, named app.UIFigure by default,
has a startupFcn callback function that you can define, which is
executed automatically when the App first starts up. This function is useful
for performing tasks such as loading data for the program or adjusting the
content of the visual layout in ways that may not be easily done in the Design
View in the App Designer tool. For illustration,
some of the code in the extrasApp example described below is placed
in this startup callback function.
Displaying Images and Graphics in Apps
In Apps, there is an Image GUI component for displaying images, with
an ImageSource property that can be used to change the image
content, as done in this code placed in the startupFcn function
for the extrasApp program:
im = imread('monaLisa.jpg');
app.Image.ImageSource = im;
The Image component can only be used to display images as shown above. It
cannot be used to display superimposed graphics and also cannot be used with the
imshow function. The Axes component, however, can be used
to display both images and other graphics, and can also use colormaps. Graphics
functions such as plot and scatter have an optional
first input that can be used to specify an Axes component for displaying in
an App, for example:
plot(app.UIAxes, xc, yc, 'r:*')
Other functions, like imshow, can also direct their output to an
Axes component, but this is instead specified with the Parent
property, for example:
imshow(im, 'Parent', app.UIAxes)
The image of Mona Lisa cited earlier is a color image stored in a
864x560x3
matrix, with the third dimension specifying the RGB values at each image
location. A 2D gray-scale image
can be shown with a colormap, where the values in the image matrix are used to
select a color from the colormap, for each image location. The
imshow function has an optional second input that can be a
colormap, for example:
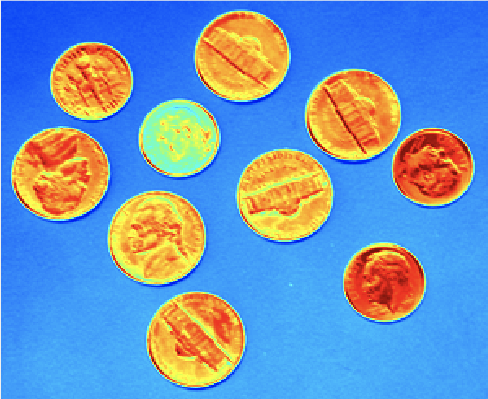
coins = imread('coins.png');
imshow(coins, jet, 'Parent', app.UIAxes)
This displays the coins image like this:
For information on how to integrate particular graphing or image display functions with Apps, see the MATLAB documentation.
Selecting a File for Reading or Writing with uigetfile and uiputfile
The built-in MATLAB functions uigetfile and uiputfile allow
the user to navigate to a desired folder and select a particular file for reading, or
specify a desired file name and file type for writing. Pushing the
get image file button on the extrasApp GUI results in the
execution of the uigetfile function that opens a dialog box that
allows the user to select an image file to load:
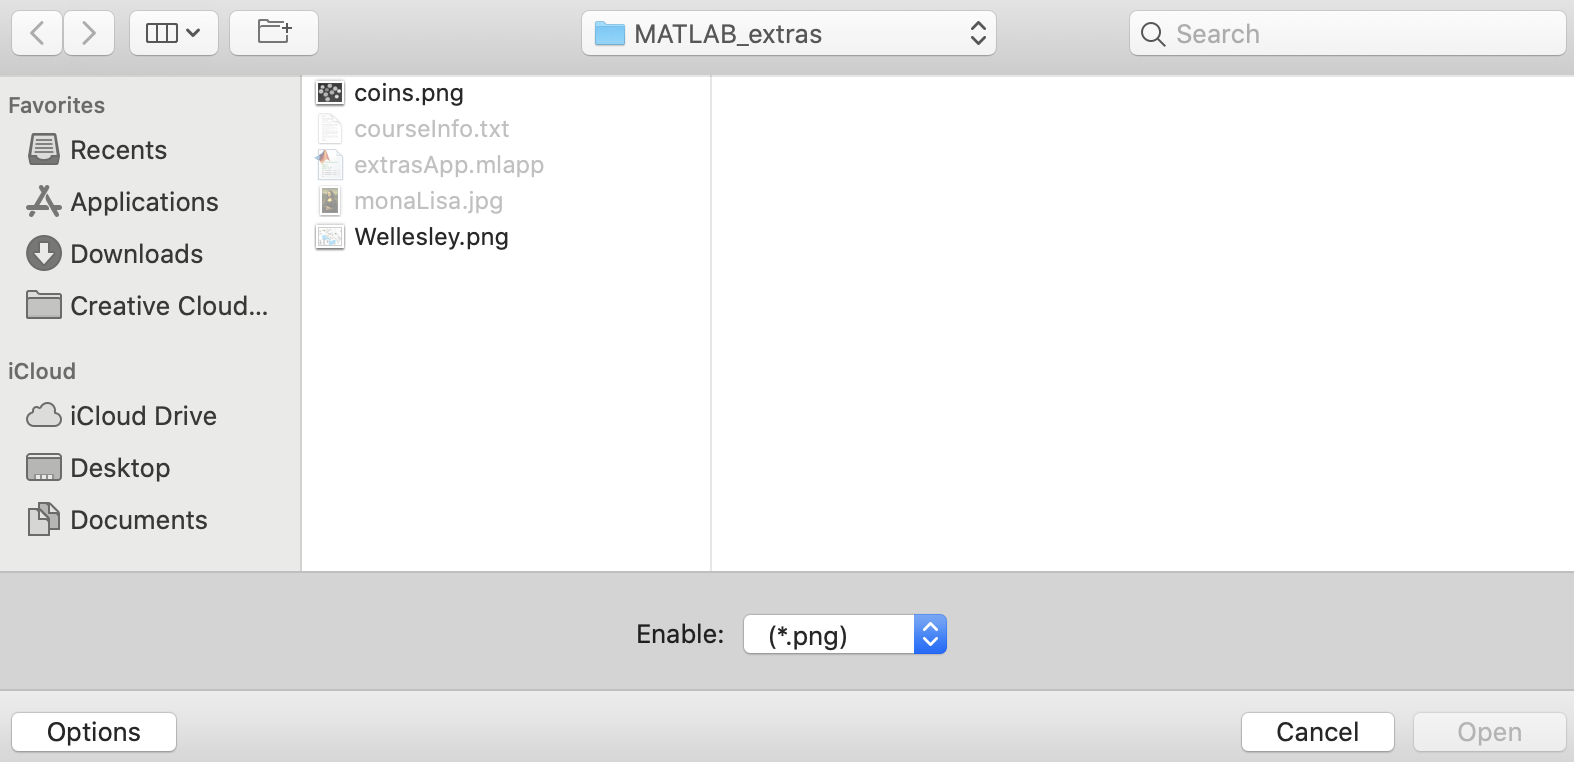
If the desired type of file is grayed out, the All Files option
can be selected from the drop-down menu labeled Enable: (the Options
button shows this menu if it's not visible).
In this example, only files with a .png file extension
are enabled because the input to uigetfile indicates this extension
for the file name:
[fileName, filePath] = uigetfile('*.png');
im = imread([filePath fileName]);
imshow(im, 'Parent', app.UIAxes))
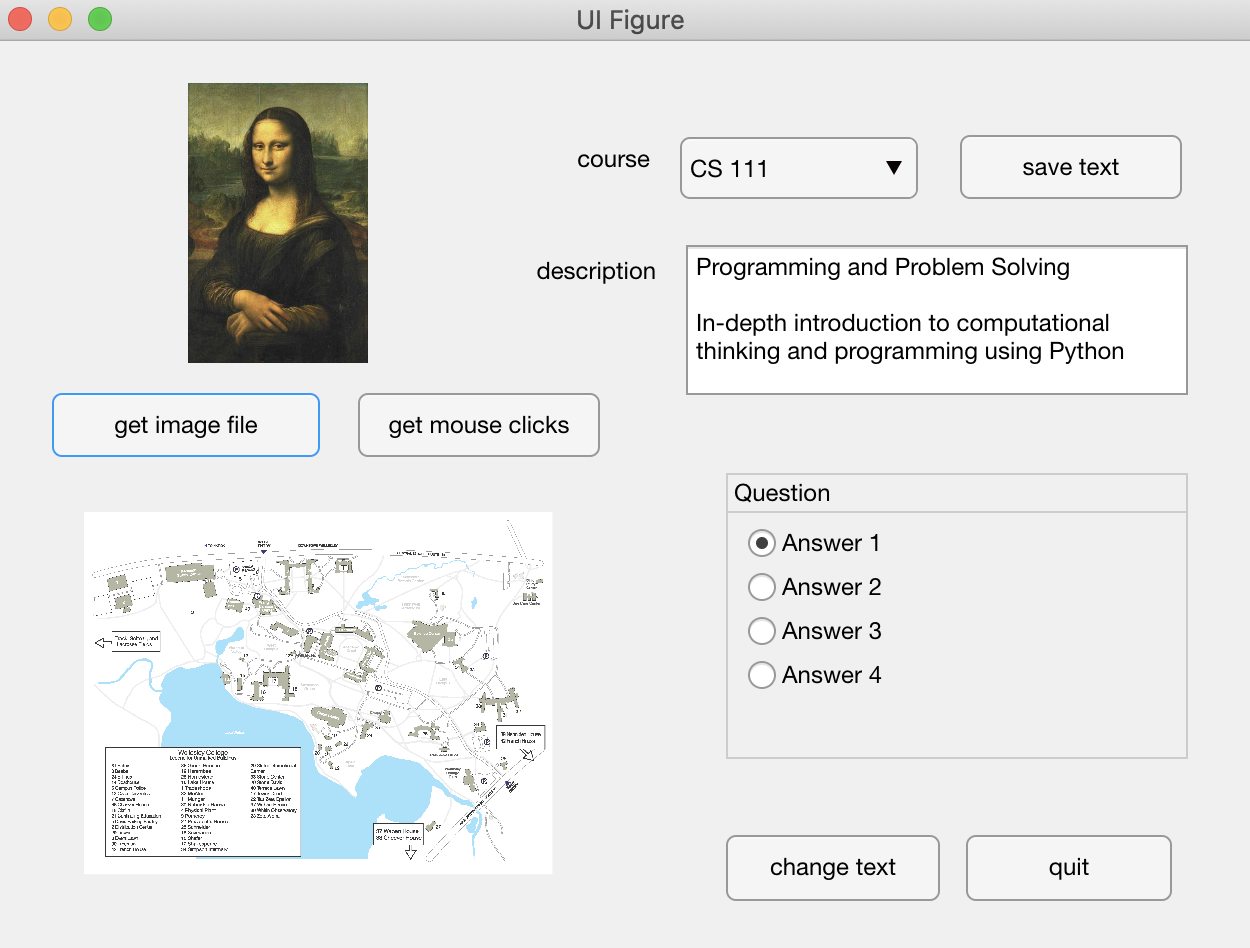
There's an image file named Wellesley.png in the MATLAB_extras
folder that contains a campus map that can be selected here. The image is read in using the
imread function and displayed on the GUI:
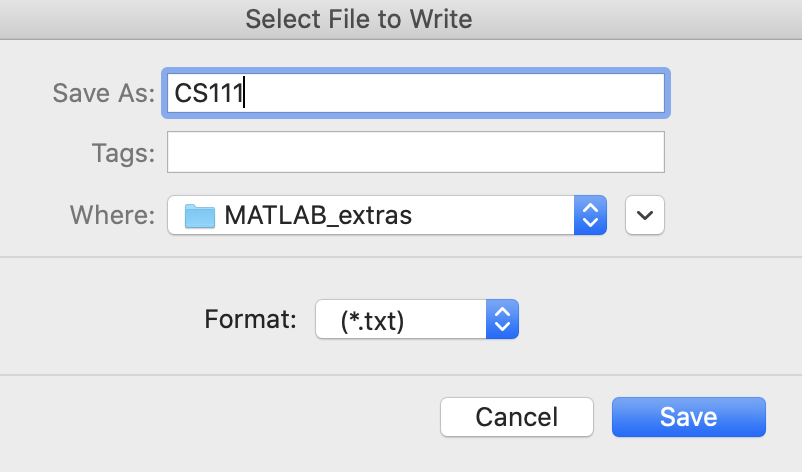
If the save text button at the top of the GUI window is pressed,
the uiputfile function is called and
a dialog box appears that allows the user to navigate to a desired folder and
specify a file name and type of file to write. You can select a name for a
textfile (such as CS111 in the example below), and click on the
Save button. The code then saves the current course description
(displayed on the GUI) in a text file named CS111.txt.
The following code performs these actions:
% allow the user to navigate to a desired folder and
% specify a file name for saving the course description
[fileName, pathName] = uiputfile('*.txt');
fid = fopen([pathName fileName], 'w');
courseDescription = app.descriptionTextArea.Value;
for i = 1:length(courseDescription)
    fprintf(fid, '%s\n', courseDescription{i});
end
fclose(fid);
Text Areas
The example illustrated above contains a Text Area GUI component
in which a course description is displayed with multiple lines of text. Selecting
a different introductory CS course from the drop-down menu results in a different
description being displayed in the Text Area. The text for these descriptions is
read from a text file
named courseInfo.txt that has the following content:
***
Programming and Problem Solving

In-depth introduction to computational
thinking and programming using Python
***
Computation for the Sciences

In-depth introduction to computational
thinking and programming using MATLAB
***
Computing for the Socio-Techno Web

Introduction to aspects of Computer
Science that impact society
***
Inventing Mobile Apps

Intro to Computer Science through
creation of apps for mobile devices
In the startup function in the extrasApp example, named
startupFcn, the content of the courseInfo.txt file is
read in and stored in a property named app.courseInfo, which gets
assigned to a cell array containing separate strings corresponding to each line
of the above text file. The following code implements this:
% load information about CS courses from a text file
fid = fopen('courseInfo.txt');
app.courseInfo = textscan(fid, '%s', 'Delimiter', '\n');
app.courseInfo = app.courseInfo{1};
fclose(fid);
Multiple lines of text can be manually entered into the Value
property box for the app.descriptionTextArea component in the
Design View in
App Designer. Alternatively, it can be added by the startupFcn
function with code such as the following:
app.descriptionTextArea.Value = app.courseInfo(2:5);
The expression on the right is a cell array containing four strings, which are the four lines of text for the CS111 course description.
When the drop-down menu of courses is changed, the following callback function is executed, which displays the course description for the newly selected course in the Text Area:
function courseDropDownValueChanged(app, event)
    value = app.courseDropDown.Value;
    index = find(strcmp(app.courseDropDown.Items, value));
    startIndices = 1 + find(strcmp(app.courseInfo, '***'));
    start = startIndices(index);
    app.descriptionTextArea.Value = app.courseInfo(start:start+3);
end
This code takes advantage of the special *** strings that were
used to separate the course descriptions in the courseInfo.txt
text file.
Recording Mouse Clicks
The getpts function can be used to record the locations of
mouse clicks made in an axis area. When the
getpts function is called, the user can click on a series
of locations in the axis area and the x,y coordinates of the
locations of the mouse clicks are recorded and stored in vectors that are
returned by the function. The final location is specified with a double-click.
Unfortunately, the getpts function cannot be used directly to
gather mouse clicks on an Axes component in an App. In the
extrasApp example, we get around this limitation by opening a
separate figure window for the user to click on a set of desired locations
with the mouse. When the user clicks on the get mouse clicks
button on the GUI, the getmouseclicksButtonPushed callback
function is invoked, which runs the code below. The wellesley.png
image is displayed both on the GUI and in a separate figure window. The
getpts function gathers the locations of mouse clicks made in the
separate figure window, and the locations of the mouse clicks are then
displayed on the main App window with the plot function:
im = imread('wellesley.png');
imshow(im, 'Parent', app.UIAxes);
figure
imshow(im);
[xcoords, ycoords] = getpts;
hold(app.UIAxes,'on')
plot(app.UIAxes, xcoords, ycoords, 'r', 'LineWidth', 3);
im = imread('wellesley.png');
Here is an example of the result of these actions:
Adding Buttons to a Radio Button Group
It appears that only three buttons can be set up directly for a Radio Button Group component, in the Design View in App Designer. Fortunately, additional buttons can be added in the Code View, with the following two steps:
- add a new Property to the app structure
- add code to the startup callback function to add the
new button to the Radio Button Group and set its
TextandPositionproperties
In the extrasApp example, the new radio button is
referred to as app.Answer4Button. The new Property is set
up as follows:
properties (Access = private)
    courseInfo = {};      % stores course descriptions
    Answer4Button = [];   % fourth button for a Radio Button Group
end
and in the startupFcn function, the following code is
added:
% create Answer4Button
app.Answer4Button = uiradiobutton(app.QuestionButtonGroup);
app.Answer4Button.Text = 'Answer 4';
app.Answer4Button.Position = [11 31 72 22];
Changing the Text in GUI Components
The text displayed on any GUI component can be changed after the
App is launched. Earlier, you saw an example of changing the text in
a Text Area component. In the extrasApp example, clicking
on the change text button invokes the
changetextButtonPushed callback function that contains
the following code that changes the options in the drop-down menu
and the text for the Radio Button Group:
app.courseDropDown.Items = {'CS231' 'CS232' 'CS235' 'CS240'};
app.QuestionButtonGroup.Title = 'Which course do you plan to take next?';
app.Answer1Button.Text = 'CS231';
app.Answer2Button.Text = 'CS232';
app.Answer3Button.Text = 'CS235';
app.Answer4Button.Text = 'CS240';
The options in a List Box can be changed in the
same way that the options for the drop-down menu are changed in the
above code.
Tips on Working with Excel Spreadsheets
The xlsread function can be used to read the content
of Excel spreadsheets into MATLAB. (In the 2019 version of MATLAB,
the documentation recommends using readtable,
readmatrix, or readcell instead, but the
xlsread function is likely to stay for some time.)
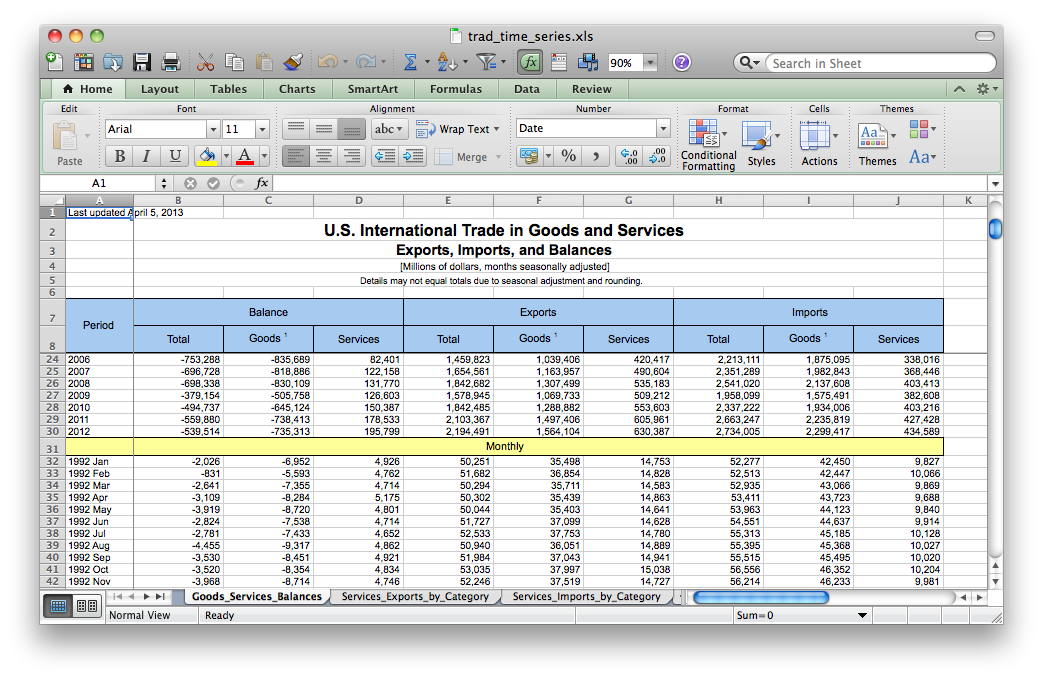
You may have difficulty reading a spreadsheet that has a complex
structure such as that shown in the following example that was
downloaded from a U.S. government website:
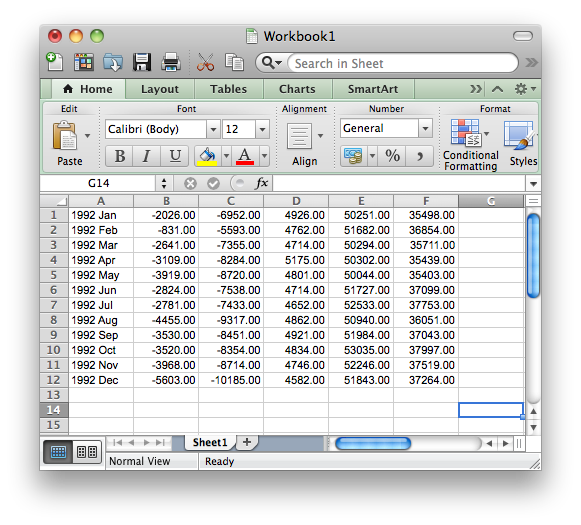
Consider creating a simpler spreadsheet that only contains the essential information in a simpler format, such as that shown here:

The format of the numbers, which contain commas, may still be
problematic for reading into MATLAB, but this format can be
changed. To do this,
select the Cells... option from the Format
menu at the top of the Excel window. The following
dialog box appears (the Number category is selected on the left):
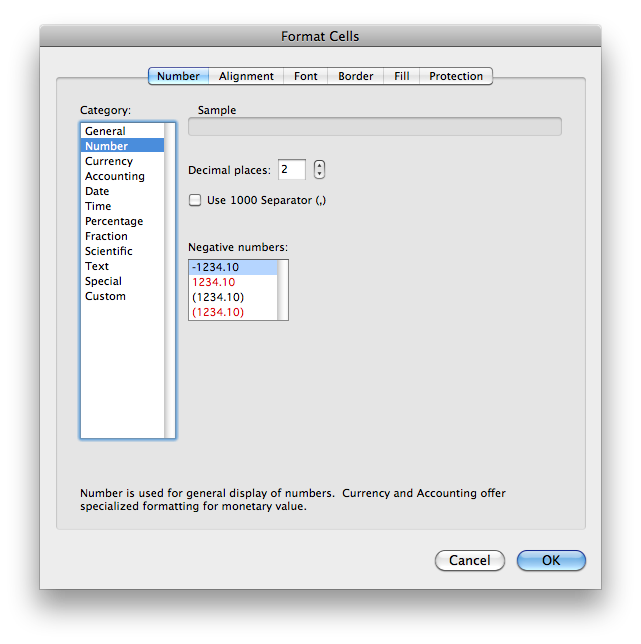
The box labeled "Use 1000 Separator (,)" should be
unchecked and the proper format for negative numbers should be selected,
as shown in the above picture. Clicking the OK button will
apply this formatting, which results in the following content:
Suppose the new spreadsheet is named dataNew.xlsx.
It can then be read into MATLAB using xlsread:
[numData txtData] = xlsread('dataNew.xls')
There is no semi-colon at the end of the statement, so the
values of numData and txtData are printed
in the Command window. numData is a matrix storing the
numerical data from the spreadsheet and txtData is a
cell array containing the strings of text stored in the first column
of the spreadsheet. If three output variables are provided when
calling the xlsread function, as shown in the following
example, the third variable will be assigned to a 2D cell array
containing all of the data in the spreadsheet.
[numData txtData allData] = xlsread('dataNew.xls')
In this example, textual data from the spreadsheet will be stored
as strings in the corresponding cells of allData and
numerical data from the spreadsheet will
be stored as numbers in the cells of allData.