Scalable Vector Graphics
An Example of SVG
Let's start with a simple example. The image you see on the left side below was created by the code in XML-like format you see on the right. This format is known as SVG (Scalable Vector Graphics), and is a vector image format for 2-D graphics. It was developed by W3C (the World Wide Web Consortium) especially for the web.
<svg width="200" height="200">
  <rect x="10" y="20" height="25" width="50"
      style="stroke: red; fill: pink; stroke-width:5px"/>
  <rect x="80" y="20" height="25" width="50"
      style="stroke: red; fill: pink; stroke-width:5px"/>
  <circle r="30" cx="70"cy="75" style="fill: pink;"/>
  <circle r="20" cx="70"cy="75" style="fill: red;"/>
  <circle r="10" cx="70"cy="75" style="fill: pink;"/>
  <rect x="10" y="105" height="25" width="50"
      style="stroke: red; fill: pink; stroke-width:5px"/>
  <rect x="80" y="105" height="25" width="50"
      style="stroke: red; fill: pink; stroke-width:5px"/>
</svg>
Why create images in SVG?
Most images created by traditional drawing programs are created as raster-images, consisting of a matrix of unit elements known as pixels (picture elements). A pixel is usally a representation of color (the three-byte combination corresponding to "red, green, blue"). Raster images have a scaling problem. If the image is small (total number of pixels is small) and we try to display it in a large-screen device, the image will appear pixelated. While some people intentionally generate such images (it is known as Pixel Art), mostly such a problem is annoying and impacts the quality of user experience with a visualization. SVG images do not use pixels, there are a text description of geometric shapes. Then, a rendering engine that understands SVG will interpret the these shapes to create the image.
One can see the difference that comes from trying to zoom in into a raster or vector image in the image below (source Wikipedia).

How to create graphics with SVG
Complex SVG images are usually created with editors such as the open-source
svg-edit,
or Inkscape.
Images with the ending .svg can be used in web pages with the normal img
tag. The Wikipedia website is famous for hosting a large number of graphics as SVG files. Below are some
exmaples, click on the image to go to the SVG source file (and do view source).


For other kinds of images, such as charts with distinct shapes (dots, lines, curves, bars, pies, etc.) it is entirely possible to generate SVG within an HTML file, to be rendered in the web page, just like every other element. SVG elements can be styled with CSS and manipulated with Javascript.
The graphics below shows all shapes that can be created with the SVG tags and styled with CSS.
The coordinate system
Remember that for everything displayed in the browser page, the origin of the coordinate system lies at the left-top corner. That is the (0,0) point. A point such as 100,20 would be 100 units toward the right side and 20 units down from the top border. Keep this in mind, as you interpret the values of points for the shapes in the example below.
Below is the source code. Notice that for each element on the page, there is a corresponding tag:
circle, rect, ellipse, line, polygon,
polyline, text, and path. In addition to the shape tags,
there are two extra tags used for the animation, animateMotion and mpath (short for
"motion path"). Notice how easy it is to read this code and understand what it does.
Finally, notice that there is no Javascript in this code.
<svg width="600" height="400" style="border:1px lightgray solid;">
  <circle r="40" cx="50" cy="50" fill="yellow" stroke="blue" stroke-width="6"></circle>
  <rect x="250" y="250" width="100" height="100" fill="yellow" stroke="red" stroke-width="10"></rect>
  <ellipse cx="480" cy="60" rx="100" ry="50" fill="lavender" stroke="purple"
              stroke-width="10"></ellipse>
  <line x1="300" y1="200" x2="600" y2="400" stroke="#0099dd" stroke-width="10"></line>
  <line x1="300" y1="200" x2="0" y2="400" stroke="#99dd00" stroke-width="10"></line>
  <polygon points="250,10 300,190 210,210" fill="#ddaaAA" stroke="purple" stroke-width="5"></polygon>
  <polyline points="450,250 470,250 470,230 490,230 490,210 510,210 510,190 530,190
               530,170 550,170 550,150" fill="white" stroke="red" stroke-width="3"></polyline>
  <text x="50" y="280" fill="#4256fd" transform="rotate(270 50,280)"
           style="font-size: 40px">I love CS</text>

  <!-- This example of animation is taken from this page:
  https://developer.mozilla.org/en-US/docs/Web/SVG/Element/animateMotion-->

  <path d="M100,110 A210,120 45 0,1 200 10 A210,120 45 0,1 100,110"
        stroke="lightgrey" stroke-width="3"
        fill="none" id="theMotionPath"></path>
  <circle cx="100" cy="110" r="4" fill="lightgrey"></circle>
  <circle cx="200" cy="10" r="4" fill="lightgrey"></circle>

  <!-- Here is a red circle which will be moved along the motion path. -->
  <circle cx="" cy="" r="5" fill="red">
      <!-- Define the motion path animation -->
      <animateMotion dur="6s" repeatCount="indefinite">
         <mpath xlink:href="#theMotionPath"/>
      </animateMotion>
  </circle>
</svg>
Learning more about SVG
As usually, W3Schools has the more accessible tutorials to learn every web technology. The one for SVG is similar. I found their reference material to be concise, however, it doesnt offer many examples.
A much better documentation on SVG seems to be maintained by the Mozilla Developer Network.
Their documentation page has sections on elements and attributes and most of them are explained through examples. It is especially useful for understanding the animation elements.
I also found this tutorial by Jacob Jenkov, to be very well written and with interesting examples.
SVG and Javascript
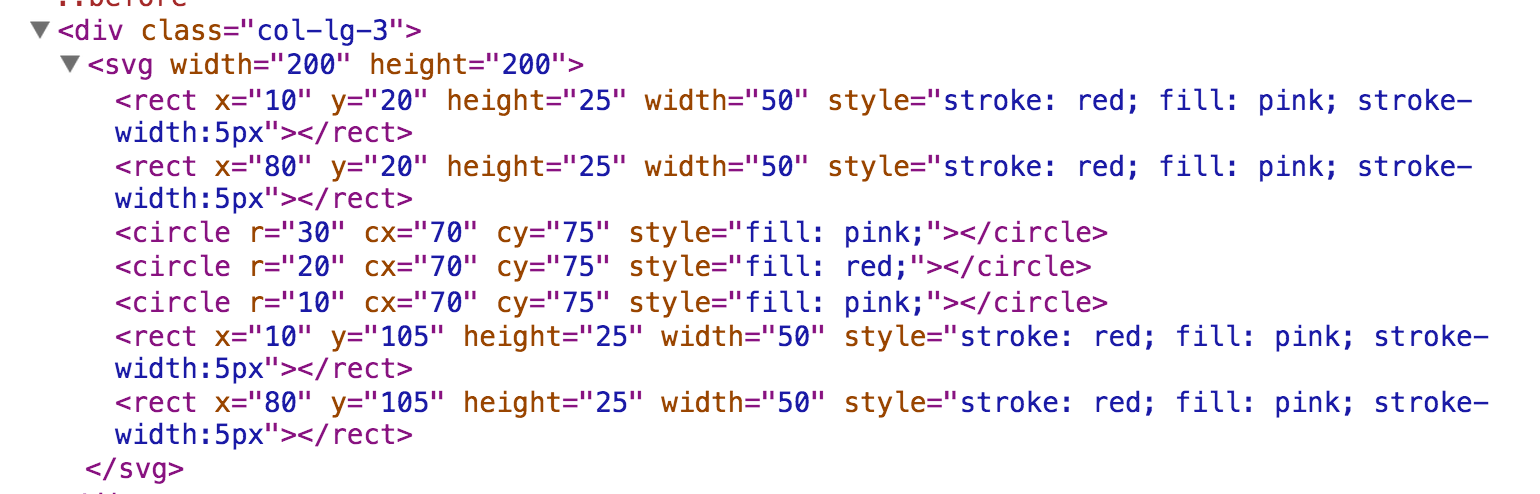
We can use Javascript to generate, add, and manipulate SVG elements in a page, in the same way that we generate, add, and manipulate HTML elements. This is because such elements are added to the DOM representation of the page. For example, if we look at the DOM tree of this page in the Inspect Element, we will see the svg image with the pink/red rectangles and circles in the DOM, see screenshot below:
Here is a simple example to see how a circle element responds to the
click event.
<!-- The SVG code in HTML-->
<svg id="ex1" width="300" height="300"
                 style="border: 1px solid gray">
    <text x="30" y="30">Click on the red dot to see it grow.</text>
    <circle r="4" cx="148" cy="148" fill="red"></circle>
</svg>
// The JS code
var circle = document.querySelector("#ex1 circle");
circle.onclick = grow_circle;

function grow_circle(){
    var radius = Number(circle.getAttribute("r"));
    circle.setAttribute("r", radius+3);
}
In the HTML portion, we created the circle element, inside the svg
container. Remember, if we don't have the svg element, the circle
element will not show up in the page. We gave the svg an id attribute, given
that we have many svg elements in our page.
In the JS code, we declare a global variable that will refer to the circle
element in the DOM. We then assign the function name grow_circle to be
the event handler for the click event on the circle. Note the lack of parens in
this line. If we were to put parens there, the function will be called once when
the page is loaded and never again.
In the body of the function grow_circle, we first read the current value
of the radius attribute (converting it to a number, since it is a string), and then assign
an increased value to the attribute.
JS Libraries for SVG
Our next lecture topic is the library D3.js, which can work with SVG elements easier than having to write code in pure Javascript. The focus of D3.js is data, in fact, D3 stands for Data-Driven Documents. D3.js is a tool to turn data into powerful visualizations.
In case your graphics are of a different nature, there are several other Javascript libraries that might be useful. Explore them to see if any suits your needs.
- Snap.svg, used by PBS Kids. See a children game.
- svg.js, see an analog clock animation.
- Raphel.js, see a polar clock animation.
If you want even more examples of such libraries, check them out in this article.
Infographics with SVG
Nowadays, it feels like infographics are everywhere on the Web. Indeed, according to the Infographics' Wikipedia page, the search volume for them on the Web has increased by 800% between 2010-2012 and now every website uses them to educate, inform, entertain. Most infographics are static and are created by tools such as Adobe Illustrator or Inkscape. However, since the format for such graphics can (among other formats) be SVG, one can embed them on a web page and add some interaction elements, if that suits the purpose of visualization.
Interactive infographics are one of the most sophisticated use of infographics today. The creator of D3.js, Mike Bostock, was hired by New York Times to generate interactive / animated infographics for their stories on the website.
Other websites that use them are HTML5 Readiness (a pure HTML infographic with zoom in and out features), or The Evolution of the Web, which is built with SVG.
Interactive vs. Animated
There is a distinction between "interactive" and "animated" visualizations, that goes back to the functionality distinction (exploratory vs. explanatory/exhibition). Interactive visualizations often require user input, the user is in charge of initiating and performing actions. In contrast, for animated visualizations, the user can "watch" a prepared performance. The example below is an animated infographic, by Mike Bostock, which appeared in the NY Times story: The America's Cup Finale: Oracle's Path to Victory.