
|
|
Assignment 6
|
|
Due: Friday, April 17
This assignment provides practice with creating interactive programs with graphical user interfaces (GUIs), using MATLAB's App Designer tool. There are two programming problems — for the first problem, you'll build a GUI sketchpad that allows the user to create a picture with simple shapes; for the second (simpler) problem, you'll build an interface for a program that allows the user to play a game of launching projectiles toward a target, building on an exercise that we did in an earlier class.
You can turn in your solutions any time on 4/17/20, and only need to submit an electronic copy of your code files. Your electronic submission is described in the section Uploading your completed work (there is no Google form to submit for this assignment). If you need an extension on this assignment, please contact Ellen or Stella. You do not need to work with a partner on any of this assignment work.
Background
The lecture videos and associated lecture notes posted for the week of March 30th, and the Lab session on Tuesday, March 31st, provide useful background for this assignment. There is also extensive online documentation on the creation of "Apps" with graphical user interfaces, using the App Designer tool.
Getting Started: Download assign6_problems
Use Cyberduck to connect to the CS server and download a copy of the assign6_problems
folder onto your Desktop. This folder contains four code files for
Problem 2: testProjectiles.m, animateTrajectory.m, addTrajectory.m, and
showTarget.m. You do not need to make any changes to these files.
Uploading your completed work
When you have completed the work for this assignment, your assign6_problems
folder should contain 7 files: the original four code files given to you (listed above), two
.mlapp files (drawApp.mlapp and launchApp.mlapp), and a
screen shot of a picture that you created with your drawApp program.
Use Cyberduck to connect to the CS file server and navigate to your
cs112/drop/assign06 folder. Drag your assign6_problems
folder to this drop folder. More details about this process
can be found on the webpage on Managing Assignment Work.
Problem 1: Create a sketchpad App
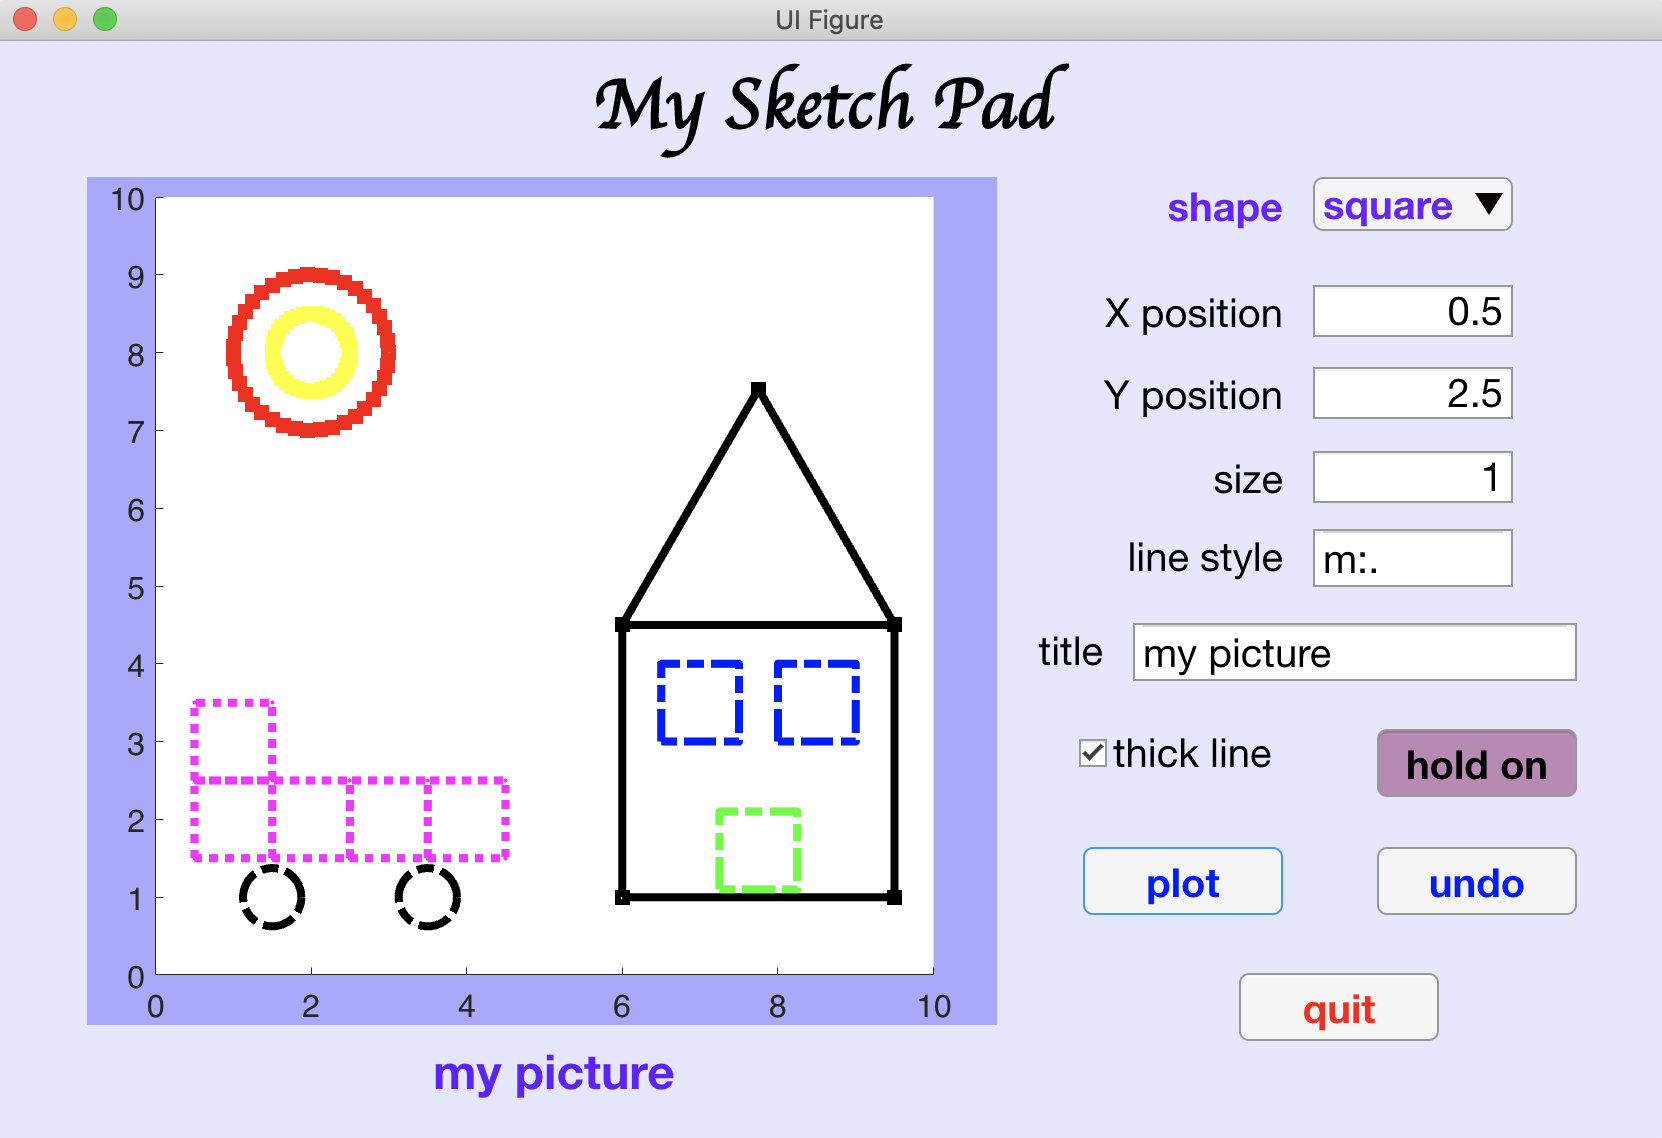
In this problem, you will build a sketchpad App that might look something like this when complete (you have creative freedom to design your layout as you like, as long as all the components are present, and you can create any picture):
Part A: Use the Design View in App Designer to create your GUI layout
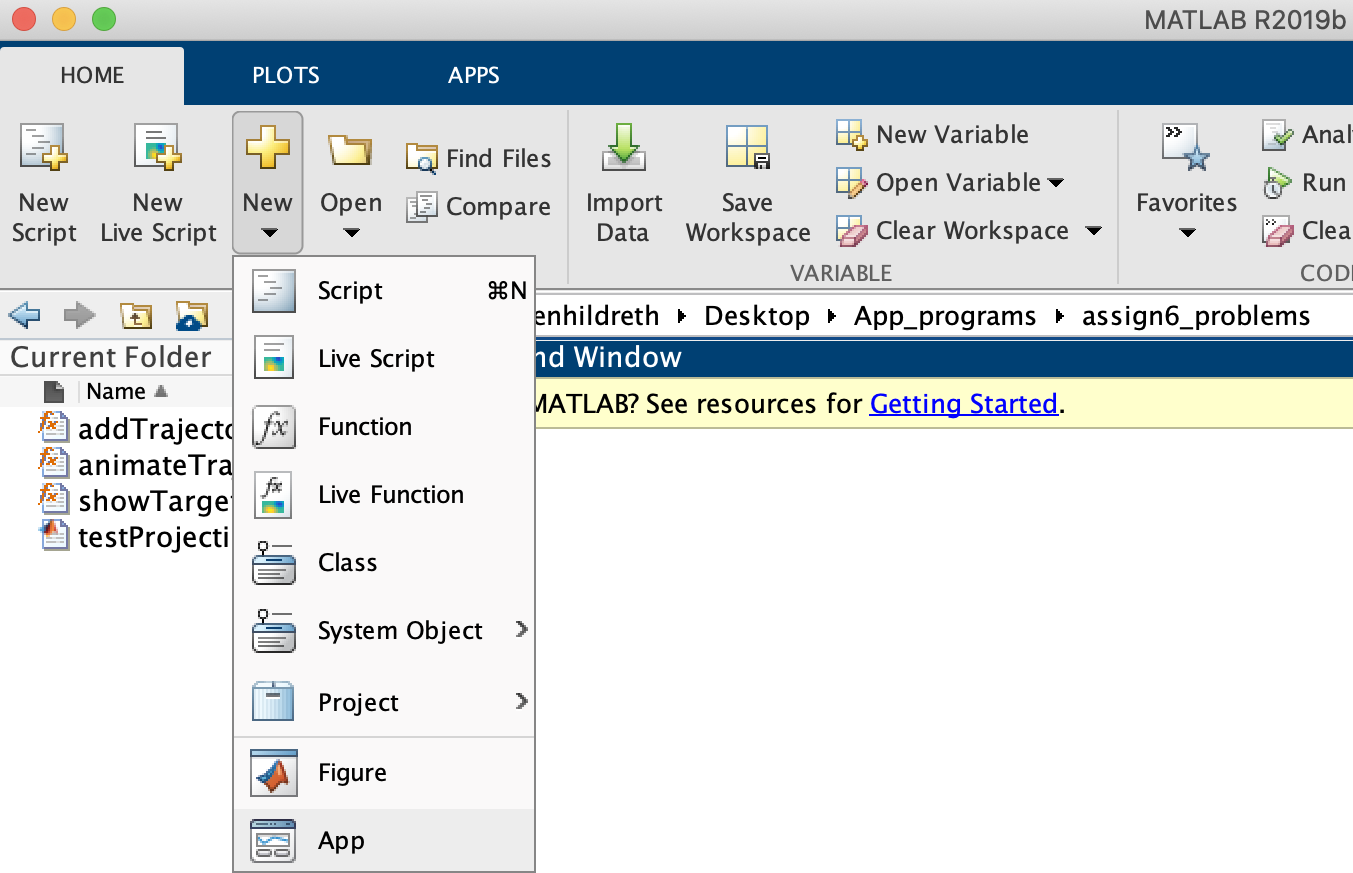
To begin, set your Current Folder in MATLAB to the assign6_problems folder, go
to the HOME tab in the toolbar at the top, click on the New
drop-down menu, and select App at the bottom of the menu, as shown below:
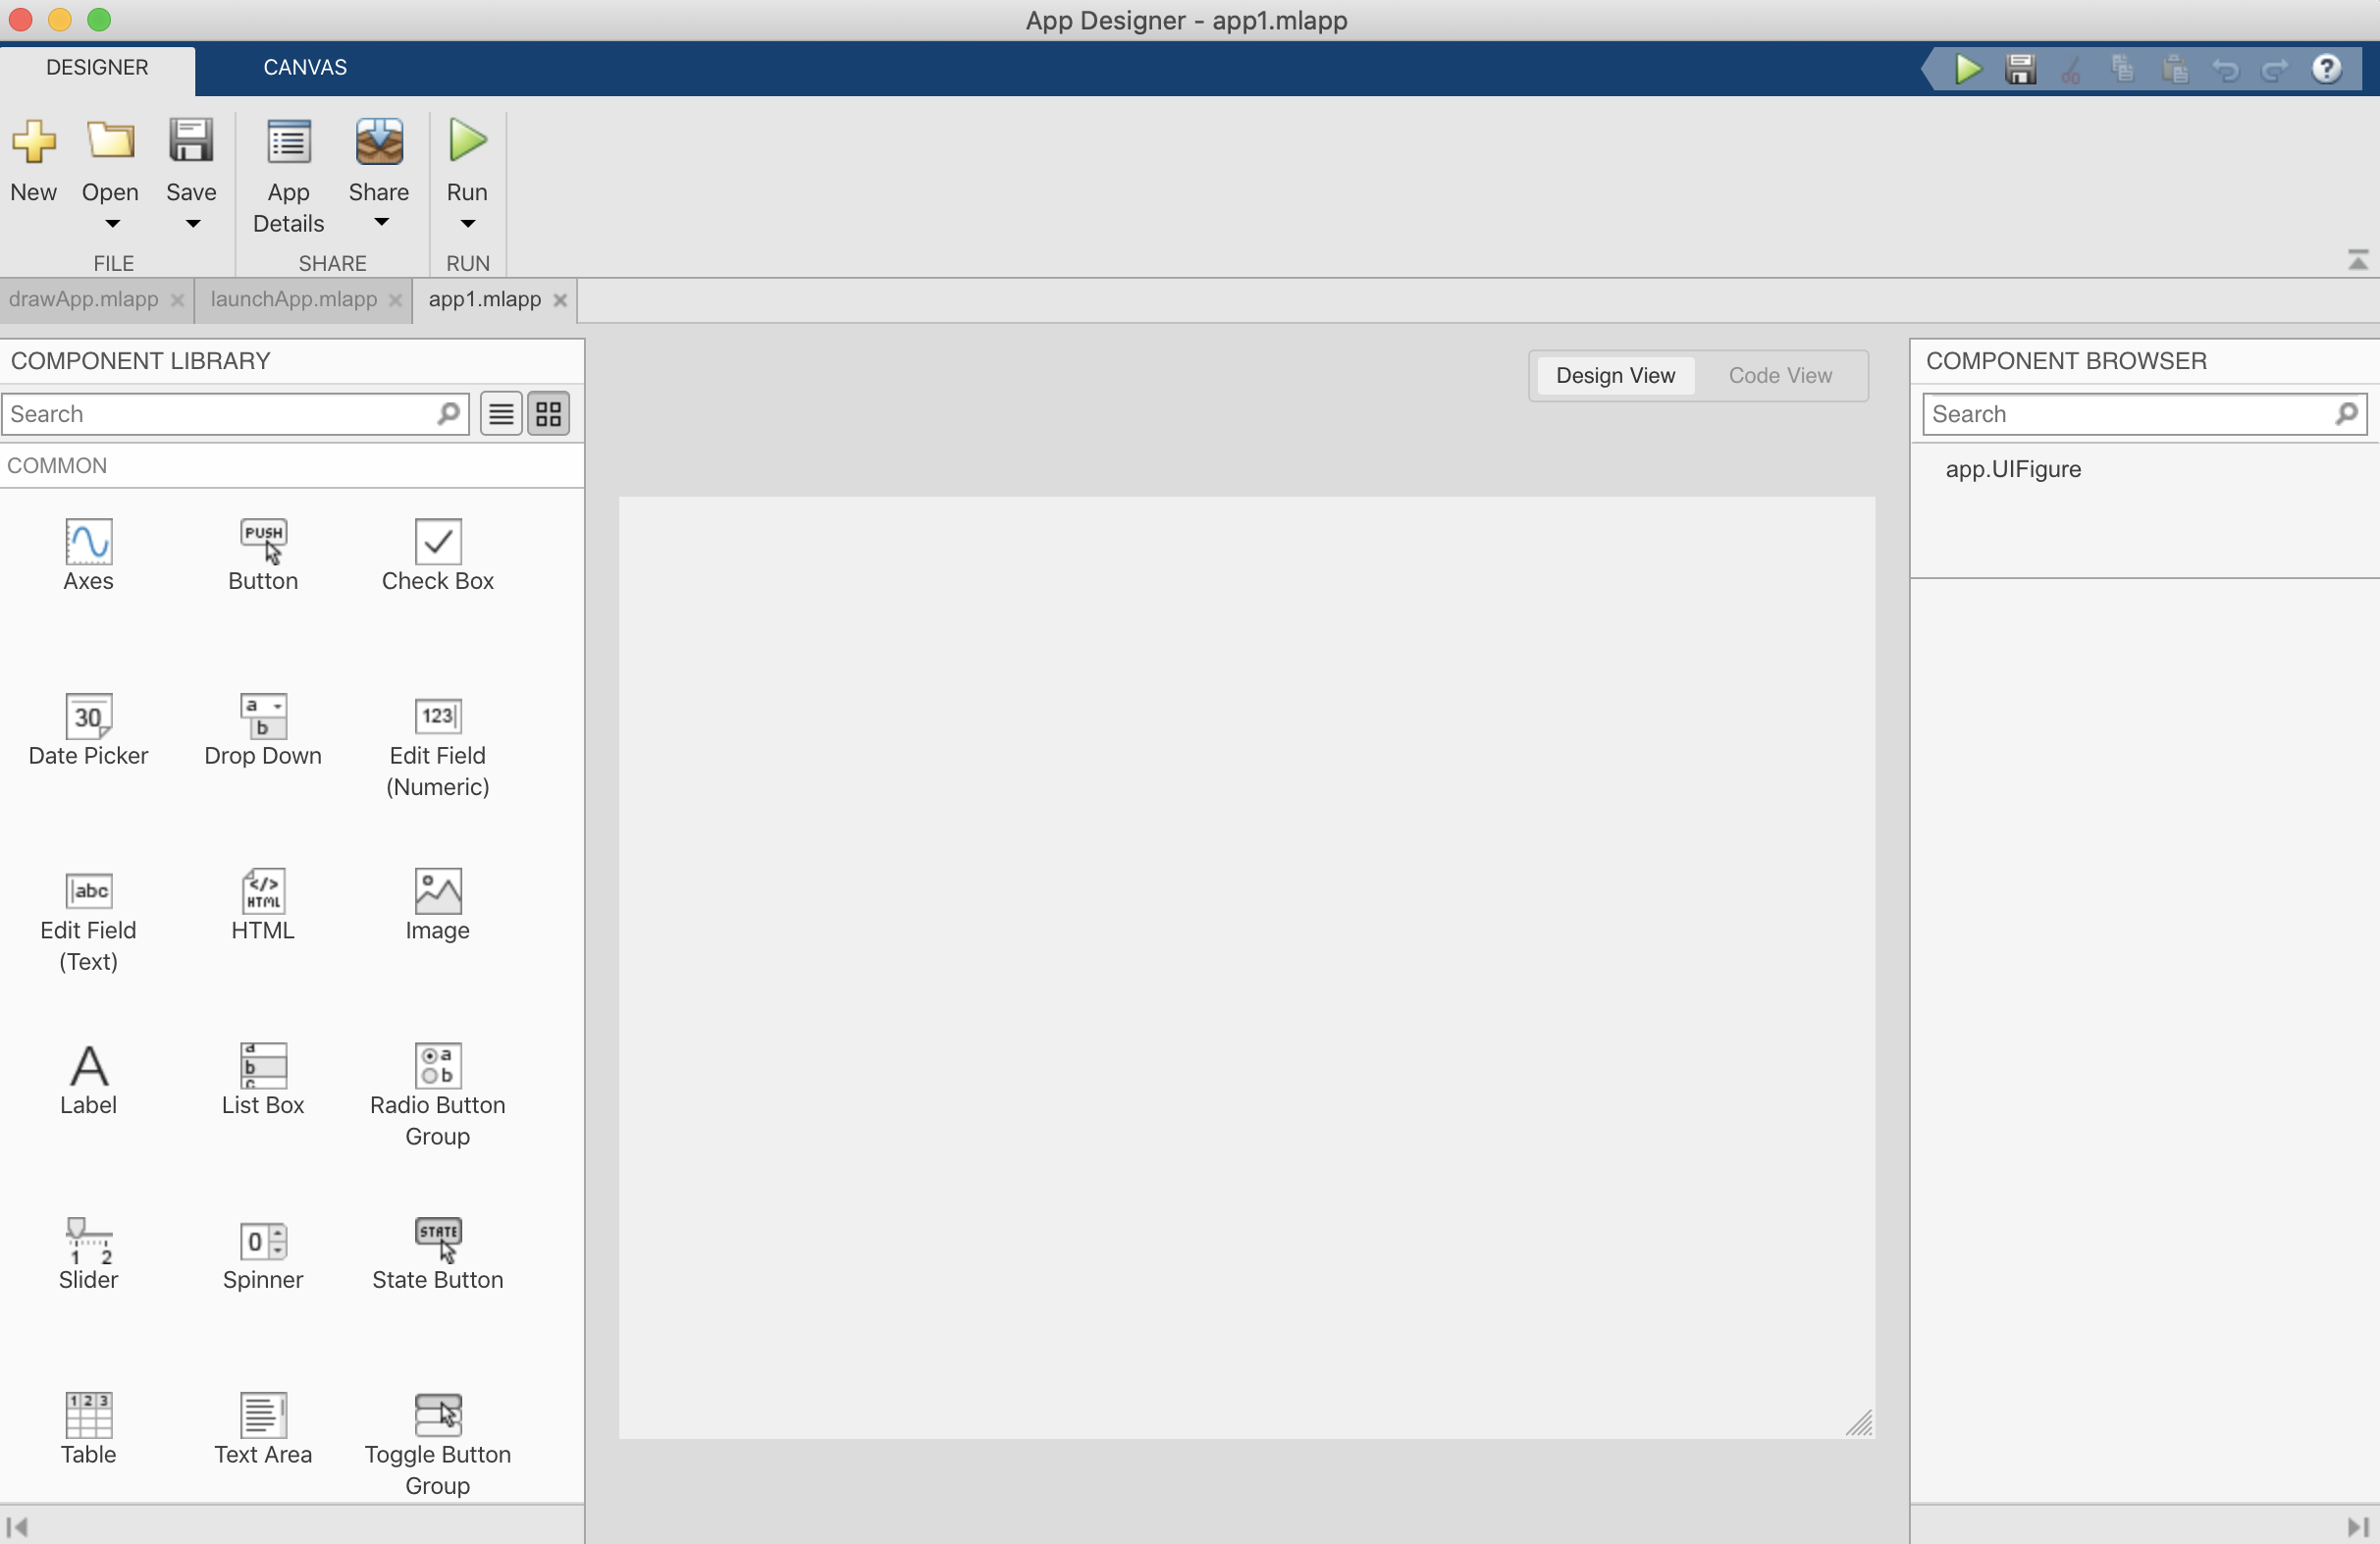
Open a new Blank App that looks like this:
Your first task is to create the visual layout of your GUI components using the
Design View in App Designer (see tabs above the central canvas). For the above example, the final Design View of the
layout looked like this:
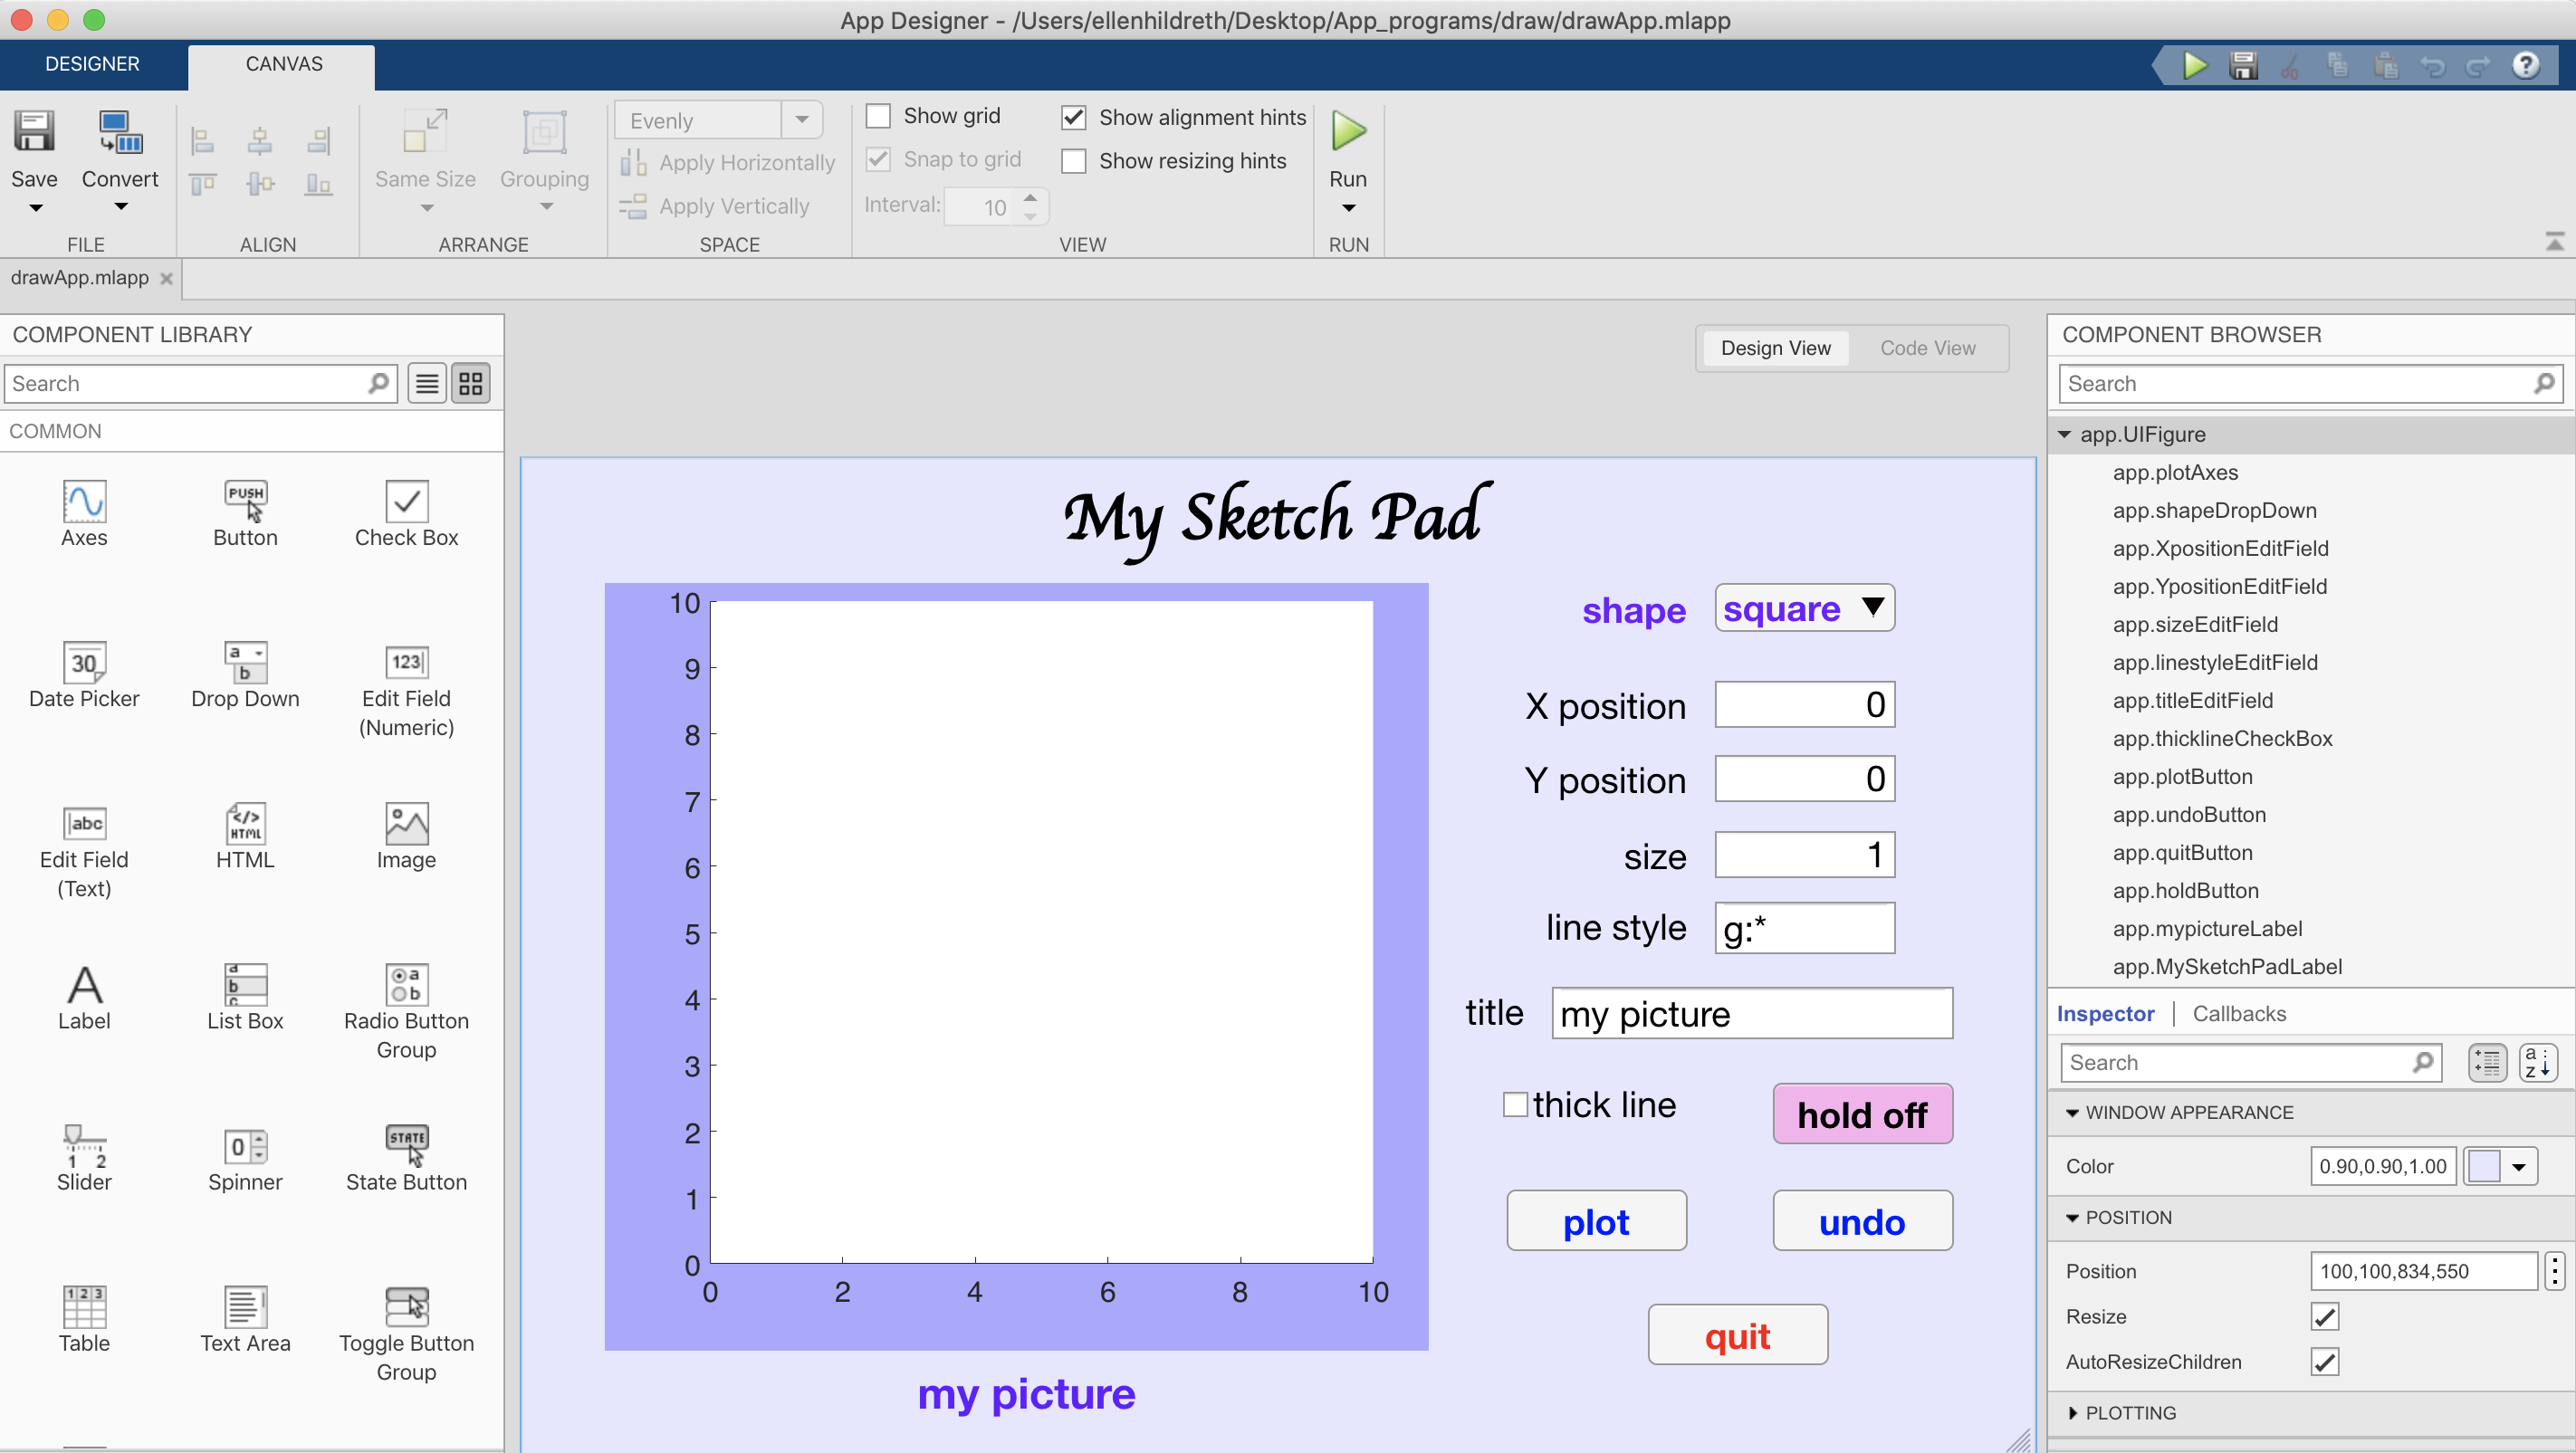
The following is the list of GUI components that you will use in your layout.
When you save your App for the first time, name it drawApp.
-
Axes:drawing window -
Drop Down: menu to select square, circle or triangle -
Edit Field (Numeric): edit boxes with labels where the user can enter the following numeric information:
-
xcoordinate of position of new figure -
ycoordinate of position of new figure - size of new figure
-
-
Edit Field (Text): edit boxes with labels where the user can enter the following text information:- line style for new figure, e.g.
g:* - name of picture
- line style for new figure, e.g.
-
Label: text labels for the picture name and the title for the program ("My Sketch Pad" above) -
Check Box: to set linewidth to 1 (if not checked) or 4 (if checked) -
State Button: to specifyhold onorhold off -
Button: buttons for each of these actions:
- plot the new figure
- undo the last plot
- terminate the program
- drag and resize the component to the desired location and size on the layout canvas
- (optional) in the upper region of the
COMPONENT BROWSERon the right, you will see a list of components with default names of the formapp.componentName. You can double-click on a name to change it to something more informative, for example, the name of the button used for plotting might be changed toapp.plotButton - click on the component on the canvas to view and set properties of its appearance in the
Inspectortab on the right. At least set these properties:- for the
Label,Check Box,State Button, andButtoncomponents, set theTextproperty by entering a desired text string in the box labeledText(or double-click on the component on the canvas to change the text string directly) - for the
Check BoxandState Buttoncomponents, set theValueproperty to its desired initial state using the checkbox labeledValue - for the
Axescomponent, you can change theTitle.String, XLabel.String,andYLabel.String(in theLABELSarea on the right) to empty strings - for the
Edit Fieldcomponents, set theLabelproperty to a desired text string, and also set theValueproperty to an initial text or numerical value that will appear when the program starts - for the
Drop Downcomponent, set theLabelproperty to a desired string, and in theDROP-DOWNarea on the right, set theValueproperty to the list item that will be selected initially, and enter all the items for the list, separated by commas, in the box labeledItems(e.g.square,circle,triangle)
- for the
- (optional) there are lots of other properties of the
components that you can set, to "spice up" the
appearance of your GUI, such as
FontColor, BackgroundColor, FontName, FontSize,andFontWeight. You can also click on the background canvas (namedapp.UIFigureby default) to set itsColorproperty
- Resizing the whole GUI:
The entire GUI window can be resized by dragging the borders or lower right corner of the canvas - Saving your work:
Click on theSaveicon in the toolbar at the top. TypedrawAppas the file name - Executing the current App:
TypedrawAppin the Command Window or click on the Run triangle in the toolbar - Revisiting this App later:
To return to this App in the App Designer editor at a later time, double-click ondrawApp.mlappin the Current Folder, or click on theOpenicon in the toolbar and navigate to this file on your laptop
Part B: Use the Code View in App Designer to add actions to the GUI
Once you have your GUI components laid out, switch to the Code View in
the App Designer window to view the starting code that MATLAB generated for your App (see image below). Here,
you will add
a callback function for each GUI component that requires an immediate action to be
performed when the user interacts with the component. For this App, you only need to create
callback functions for five of the GUI components:
-
Edit Field (Text)where the user enters a picture name -
State Buttonwhere the user selectshold onorhold off - plot button that plots the selected shape with the desired properties
- undo button that deletes the last shape that was drawn
- quit button
To begin, select one of the above GUI components in the COMPONENT BROWSER on the right,
and then select the Callbacks tab below the list of GUI component names,
circled in red in the image below:
The following notes provide guidance on implementing each of the five callback functions, starting with the simplest ones:
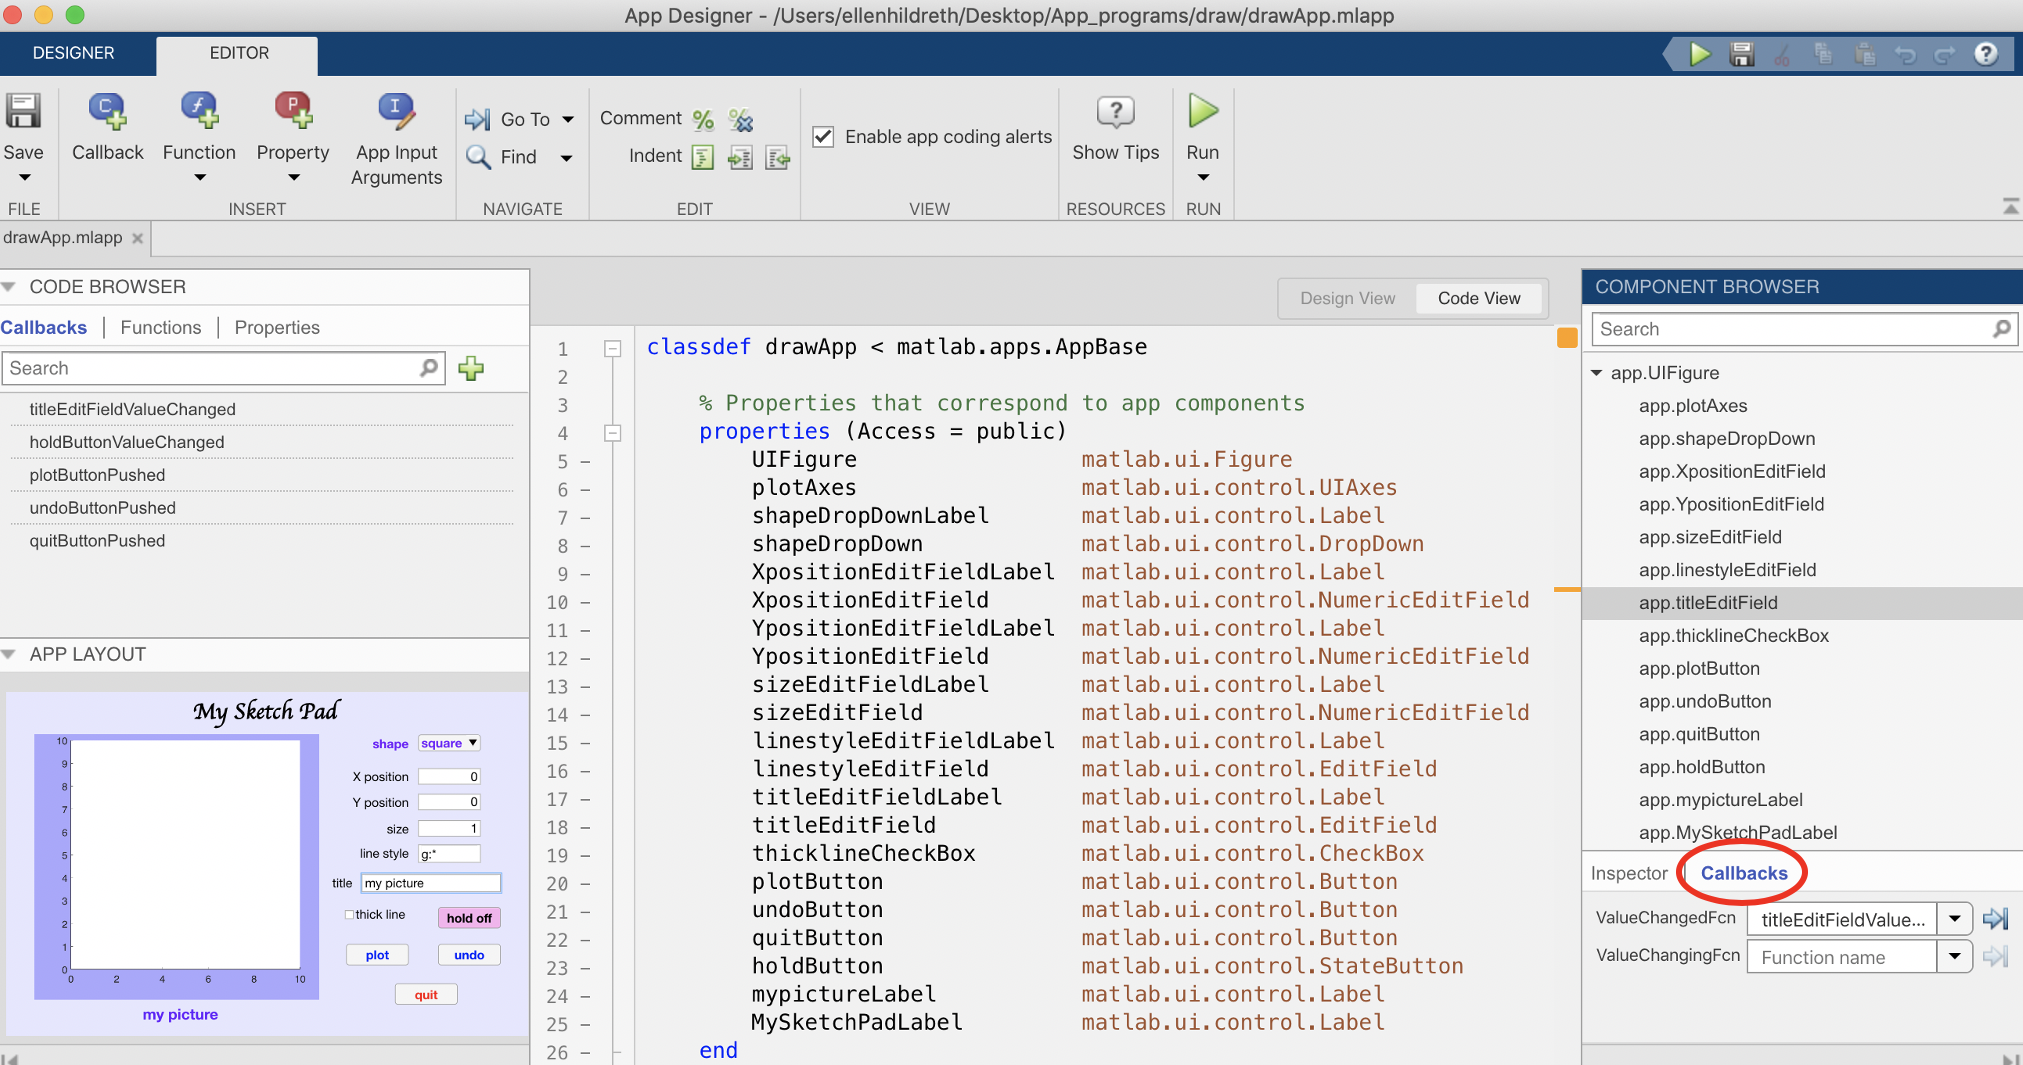
(1) Edit Field (Text) for picture title
Select the name of this GUI component (app.titleEditField in the above image).
In the Drop Down menu labeled ValueChangedFcn, select the
<add ValueChangedFcn callback> item. Code will appear in the middle of
the Code View with an area with white background where you can enter code:
An assignment statement is given that assigns the variable value to the text string
that the user entered into this Edit Field. Add one statement that assigns the Text property
of your picture label to this string. For the example above, the picture label is named
app.mypictureLabel, so its Text property is app.mypictureLabel.Text.
After adding this statement, save and run your App to test this callback (change the text string and
hit the Return key, and you should see the text in your picture label).
(2) quit button
In the list of GUI components, select the name of the quit button (app.quitButton in
the above example), add a ValueChangedFcn callback function, and add one
statement to this function to terminate the program: delete(app). Save and run
your App again to test this function.
(3) hold on/off button
Here, you can follow the example of the State Button in the energyApp
example from the lecture video and notes, which toggled between "produce" (production data)
and "consume" (consumption data). Select the GUI component for this button (app.holdButton
in the above example) and add a ValueChangedFcn callback. The code already has a
statement that assigns the variable value to the Value property of this
toggle button. Follow the earlier energyApp example to construct an if
statement to switch between the two strings hold on and hold off.
There is one
more addition to make to this if statement. When the text is changed, the actual hold state
should also be changed. Previously, we added the statement hold on or hold off
to our code to accomplish this.
In the case of an App, we need to call the hold function, which has two inputs: (1) the name
of the Axes component where the picture is displayed (app.plotAxes in the above
example), and (2) a string that is either 'on' or 'off'. For example, to set
hold on, we can write hold(app.plotAxes,'on') for the above example. Save and run
your App to test whether you can successfully toggle this button between the hold on and
hold off strings.
(4) plot button
A Button component has a ButtonPushedFcn callback function that is invoked
when the user
presses the button. Select the name of the plot button in the COMPONENT BROWSER and add a
ButtonPushedFcn callback function. Similar to the energyApp example, we need to
gather the user's input from the GUI and then plot the selected shape with the
desired properties. This can be done with the following steps:
- determine which shape is selected (square, circle, or triangle).
A
Drop Downcomponent has aValueproperty that is automatically assigned to the particular string that the user selected in the menu. In the above example, this choice would be referred to asapp.shapeDropDown.Value. - construct
x,ycoordinates for the selected shape, initially assuming generic shapes: (1) a square of size1with its lower left corner at the origin, (2) a circle of radius1centered on the origin, and (3) a triangle of size1with its lower left corner at the origin:square:
xc = [0 0 1 1 0] yc = [0 1 1 0 0]
circle:xc = cos(linspace(0,2*pi,40)/2 yc = sin(linspace(0,2*pi,40)/2
triangle:xc = [0 0.5 1 0] yc = [0 0.866 0 0] - get the X position, Y position, size, and line style entered by the user, and store each of these
values in a variable, e.g.
xpos = app.XpositionEditField.Value(X position in the above example) - get the
Valueproperty of theCheck Boxcomponent and assign a variable to different widths (say, 1 or 4) depending on whether or not the box is checked - call the
plotfunction with the inputs constructed above (think about how the size and position alter thex,ycoordinates of the shape). When calling theplotfunction in an App, add an input at the beginning that is the name of theAxeswhere the plot is to be drawn (e.g.plot(app.plotAxes, ...)in the above example) - (optional) add a call to the
axisfunction to maintain a fixed canvas size as you draw your picture. This function also has an optional input at the beginning that is theAxesarea where the axis ranges are applied, e.g.axis(app.plotAxes, [0 10 0 10])
Thoroughly test your plot button with all three shapes and different values for the other GUI components.
(4) undo button
As you create a picture with your App, it would be nice to be able to remove the last shape you added, if it doesn't quite fit the design you have in mind. The undo button will enable this. As background for this task, we first introduce the idea of assigning a plot to a variable that can later be deleted. In the following code, three plots are added to a figure, with each assigned to a separate variable:
p1 = plot([1 2 3], [2 4 1], 'r');
hold on
p2 = plot([1 2 3], [8 3 5], 'g');
p3 = plot([2 3 4], [3 5 0], 'b');
A single plot can be selectively removed from a figure with the delete function,
e.g. delete(p2). Now consider placing all the plots on a vector:
myPlots = [];
myPlots(end+1) = plot([1 2 3], [2 4 1], 'r');
hold on
myPlots(end+1) = plot([1 2 3], [8 3 5], 'g');
myPlots(end+1) = plot([2 3 4], [3 5 0], 'b');
An individual plot on the vector can be removed from the figure with delete,
but in this case, if we want the vector to contain only the plots that are actually displayed, we
also need to remove the associated plot from the vector, for example:
delete(myPlots(1))
myPlots(1) = []
We will use this idea to implement the callback function for the undo button. In particular, all the current plots (shapes) in a picture will be stored on a vector.
We will also draw on additional background from the energyApp example.
Recall that we added a new property to the app structure that was assigned
to the data for the program (this data was stored in a structure that contained matrices of
production and consumption data and a vector of years). Adding a property to the app
structure means that it can then be accessed by any function that we add to the code file for the App.
In the drawApp code, the callback functions for the plot and undo buttons both need to
access the vector of plots in the picture.
The undo task can be implemented with the following steps:
- select the name of the undo button in the
COMPONENT BROWSERand add aButtonPushedFcncallback function - in the upper left corner of the
Code Viewwindow, select the+Propertyicon (circled in the image below) to add a new property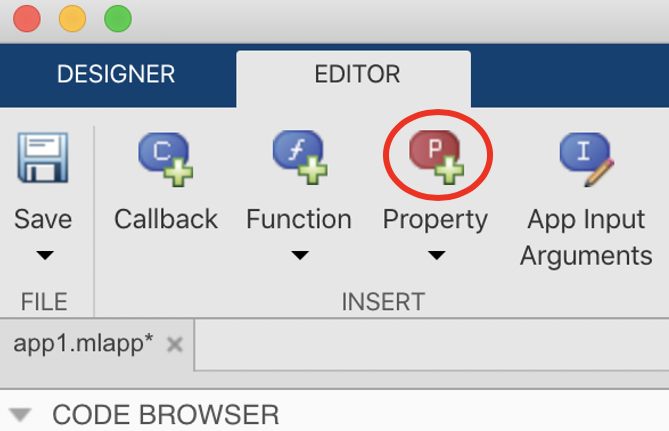
New code will appear that can be modified: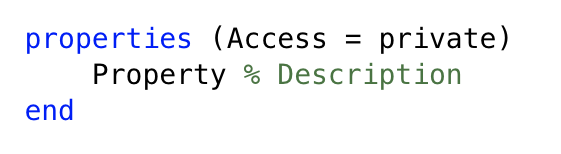
Change
Propertyto a name for the vector of plots (e.g.plotsSoFar) and assign it to an empty vector - add an
ifstatement to the callback function for the undo button that embodies the following logic: if there are no plots to undo, print a message to the user (this will appear in the Command Window), otherwisedeletethe last plot from the display and remove it from the vector - modify the callback function for the plot button to do the following: (1) add an
ifstatement that resets the vector of plots to an empty vector if the hold is currently off (as indicated by the state of the hold button), and (2) add the new plot to the end of the plots vector
Part C: Test your program and create a picture
Thoroughly test your App to make sure it really works. Then create a
picture and take a "snapshot" of your final creation. The following two pages include information on
how to create a snapshot of a Mac or PC screen. You do not need to print a copy, just include the
screenshot file in your assign6_problems folder.
Problem 2: Creating a Launchpad App
This problem provides practice with three new GUI components (List Box, Radio Button
Group, Slider) and creates a simple game that's fun to play. It builds on an example that we
did in class,
which involved plotting the trajectory of a projectile launched with an initial speed and angle (see the
description in the lecture handout in functions zip).
In this problem, you'll just build a GUI interface to use code for drawing and animating trajectories
that is given to you. In particular, the assign6_problems folder contains the following
three functions and script (you do not need to make any changes to these code files):
animateTrajectory(ax, V0, theta, targetDist)
Given the name of anAxesarea where the trajectory is displayed (ax), an initial launch speed (V0that is specified as an integer (1, 2, or 3) corresponding to slow, medium, or fast speed, initial angle in degrees (theta), and distance to a target in meters (targetDist), this function displays an animation of the trajectory. This picture shows an example of a completed trajectory: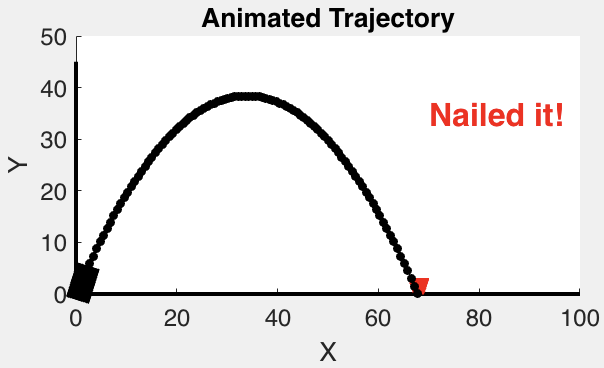
addTrajectory(ax, V0, theta, color)
Given the name of anAxesarea (ax), initial launch speed 1, 2, or 3 (V0), initial angle (theta), and color for the trajectory, this function adds the trajectory to an existing display. This function can help you to understand the relationship between the initial launch parameters and the trajectory that is produced. This picture shows an example of the results of adding several trajectories with different initial speeds, angles, and colors: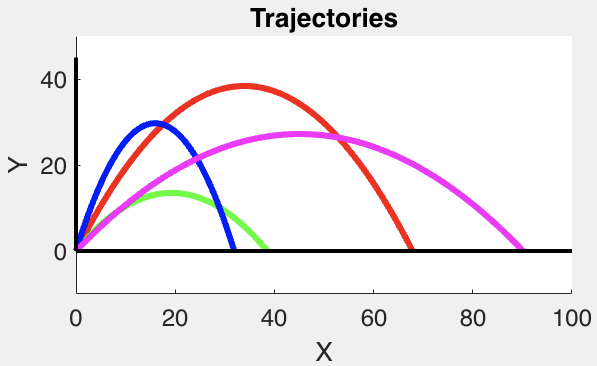
showTarget(ax, targetDist)
Given the name of anAxesarea (ax) and distance to a target (targetDist), this function adds a red target to the display (as seen in theanimateTrajectoryexample above)testProjectiles
This script contains calls to theanimateTrajectoryandaddTrajectoryfunctions to illustrate how they are used. You can call this script immediately, to view the examples.
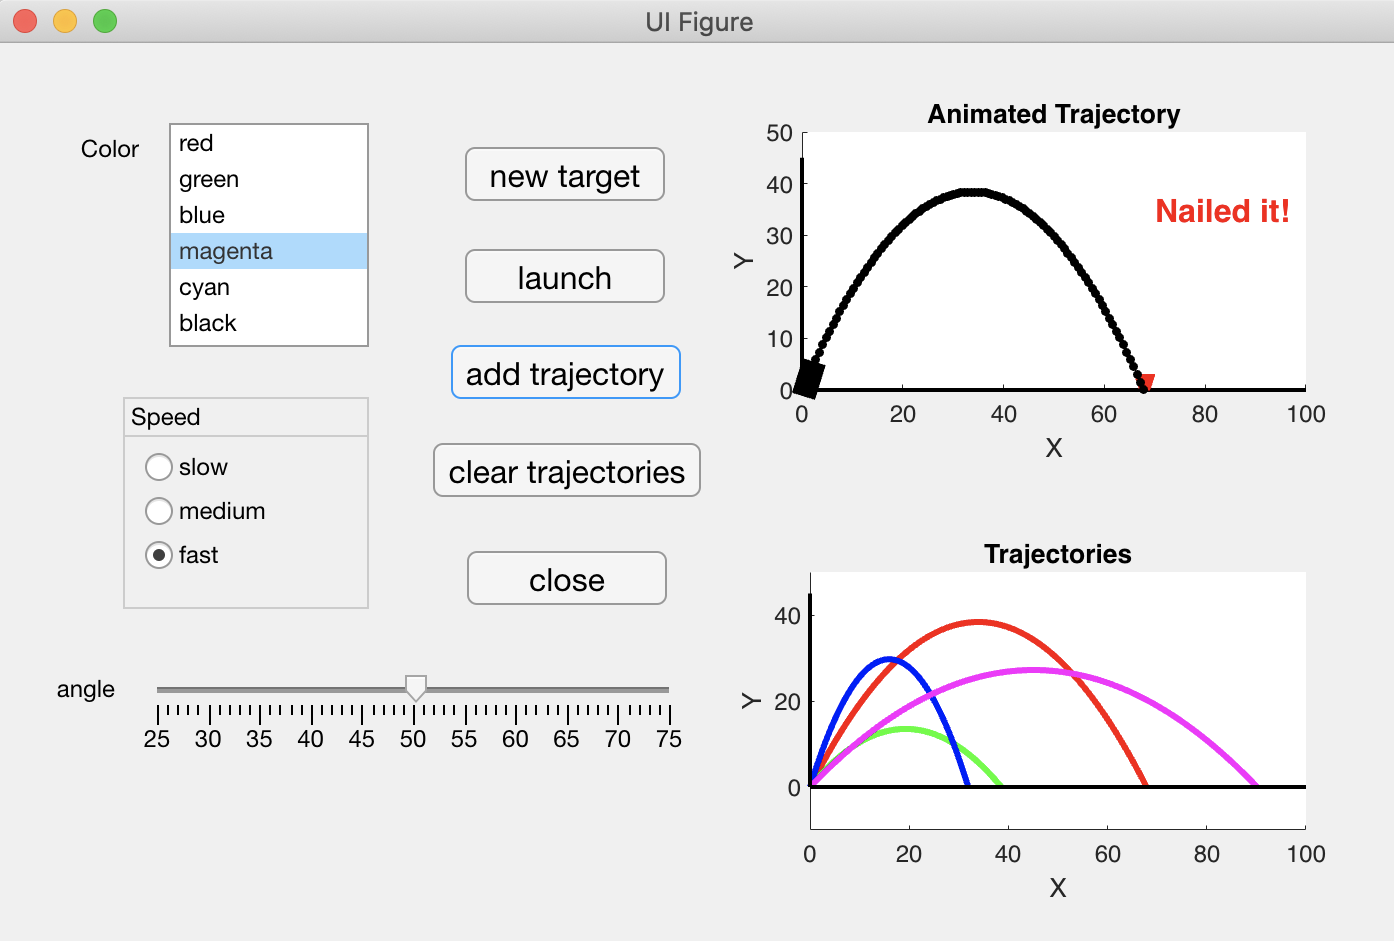
Your task is to create an App that allows the user to view projectile trajectories through a GUI, and try to adjust parameters of the trajectory to hit a target. Your final GUI layout might look something like this:
Part A: Use the Design View in App Designer to create your GUI layout
Start with a new Blank App in App Designer as you did for Problem 1, and create the layout of
the GUI components in the Design View. This layout will include three new components:
List Box: allows the user to select the color of the trajectory. After dragging this component to the canvas, set theLabel, Value,andItemsproperties in theInspectoras you did for theDrop Downmenu in thedrawAppprogramRadio Button Group: allows the user to select one of three possible speeds (slow, medium, fast). At any one time, only one of the radio buttons can be selected. After dragging this component to the canvas, change theTitleat the top of the button group, and then select each button and change itsValueandTextproperties (only one of the buttons can have itsValueproperty "checked")Slider: allows the user to set an angle that lies within some range. After dragging this component to the canvas, change itsLabelproperty and set theLimitsproperty to range from 25 to 75 degrees (enter25,75in the property box labeledLimits). TheValueproperty corresponds to the value (within the specified range) that the user selects with the slider (set to the left end of the range by default)
Save and run your App to see how the GUI looks, and name the program launchAPP.
Part B: Use the Code View in App Designer to add actions to the GUI
There is one piece of information that needs to be accessed in two callback functions, the distance to the
current target. Add a new property to the app structure (select the +Property icon in
the toolbar to access this area of the code file) to store a target distance. You can assign this to a random integer that is
within a certain range using the randi function, e.g. randi([30 80]).
For each of the five Button components, add a ButtonPushedFcn callback function
to implement these actions:
- close button: terminate the program
- new target button: assign the target distance property to a new random value and call the
showTargetfunction to display the red target in theAxesthat you created for the animation - launch button: create a variable for initial speed that is either 1, 2 or 3 depending on whether the
slow, medium, or fast radio button is selected by the user, and then call the
animateTrajectoryfunction. For the angle of launch, you can refer directly to theValueproperty for theSliderGUI component - add trajectory button: same as the launch button, but the
addTrajectoryfunction is called instead - clear trajectories button: clear the two
Axesusing theclafunction, e.g.cla(app.launchAxes)
Be sure to thoroughly test your launchApp program, and enjoy trying to nail the target!