Part 3: Data Visualizations of Digital Tracees
Select a date range to see my Spotify and Instagram app usage during that time!
Spotify Weekly Listening Time (Line Chart)
Spotify Average Listening Time By Hour (Heatmap)
Instagram Average Posts Liked By Hour (Heatmap)
When displaying usage data over long periods of time, the heat maps show at what times on average I’m more likely to be listening to music or liking posts on Instagram (whatever I use my phone for, it is likely I will also use either one or the other).
If you specify a smaller range of days, the heat maps will show my average time spent on each respective app. Over periods of time when I have a consistent schedule, you are able to see how listening times and time spent on instagram corresponds inversely with when I have class or recurring extracurricular activities.
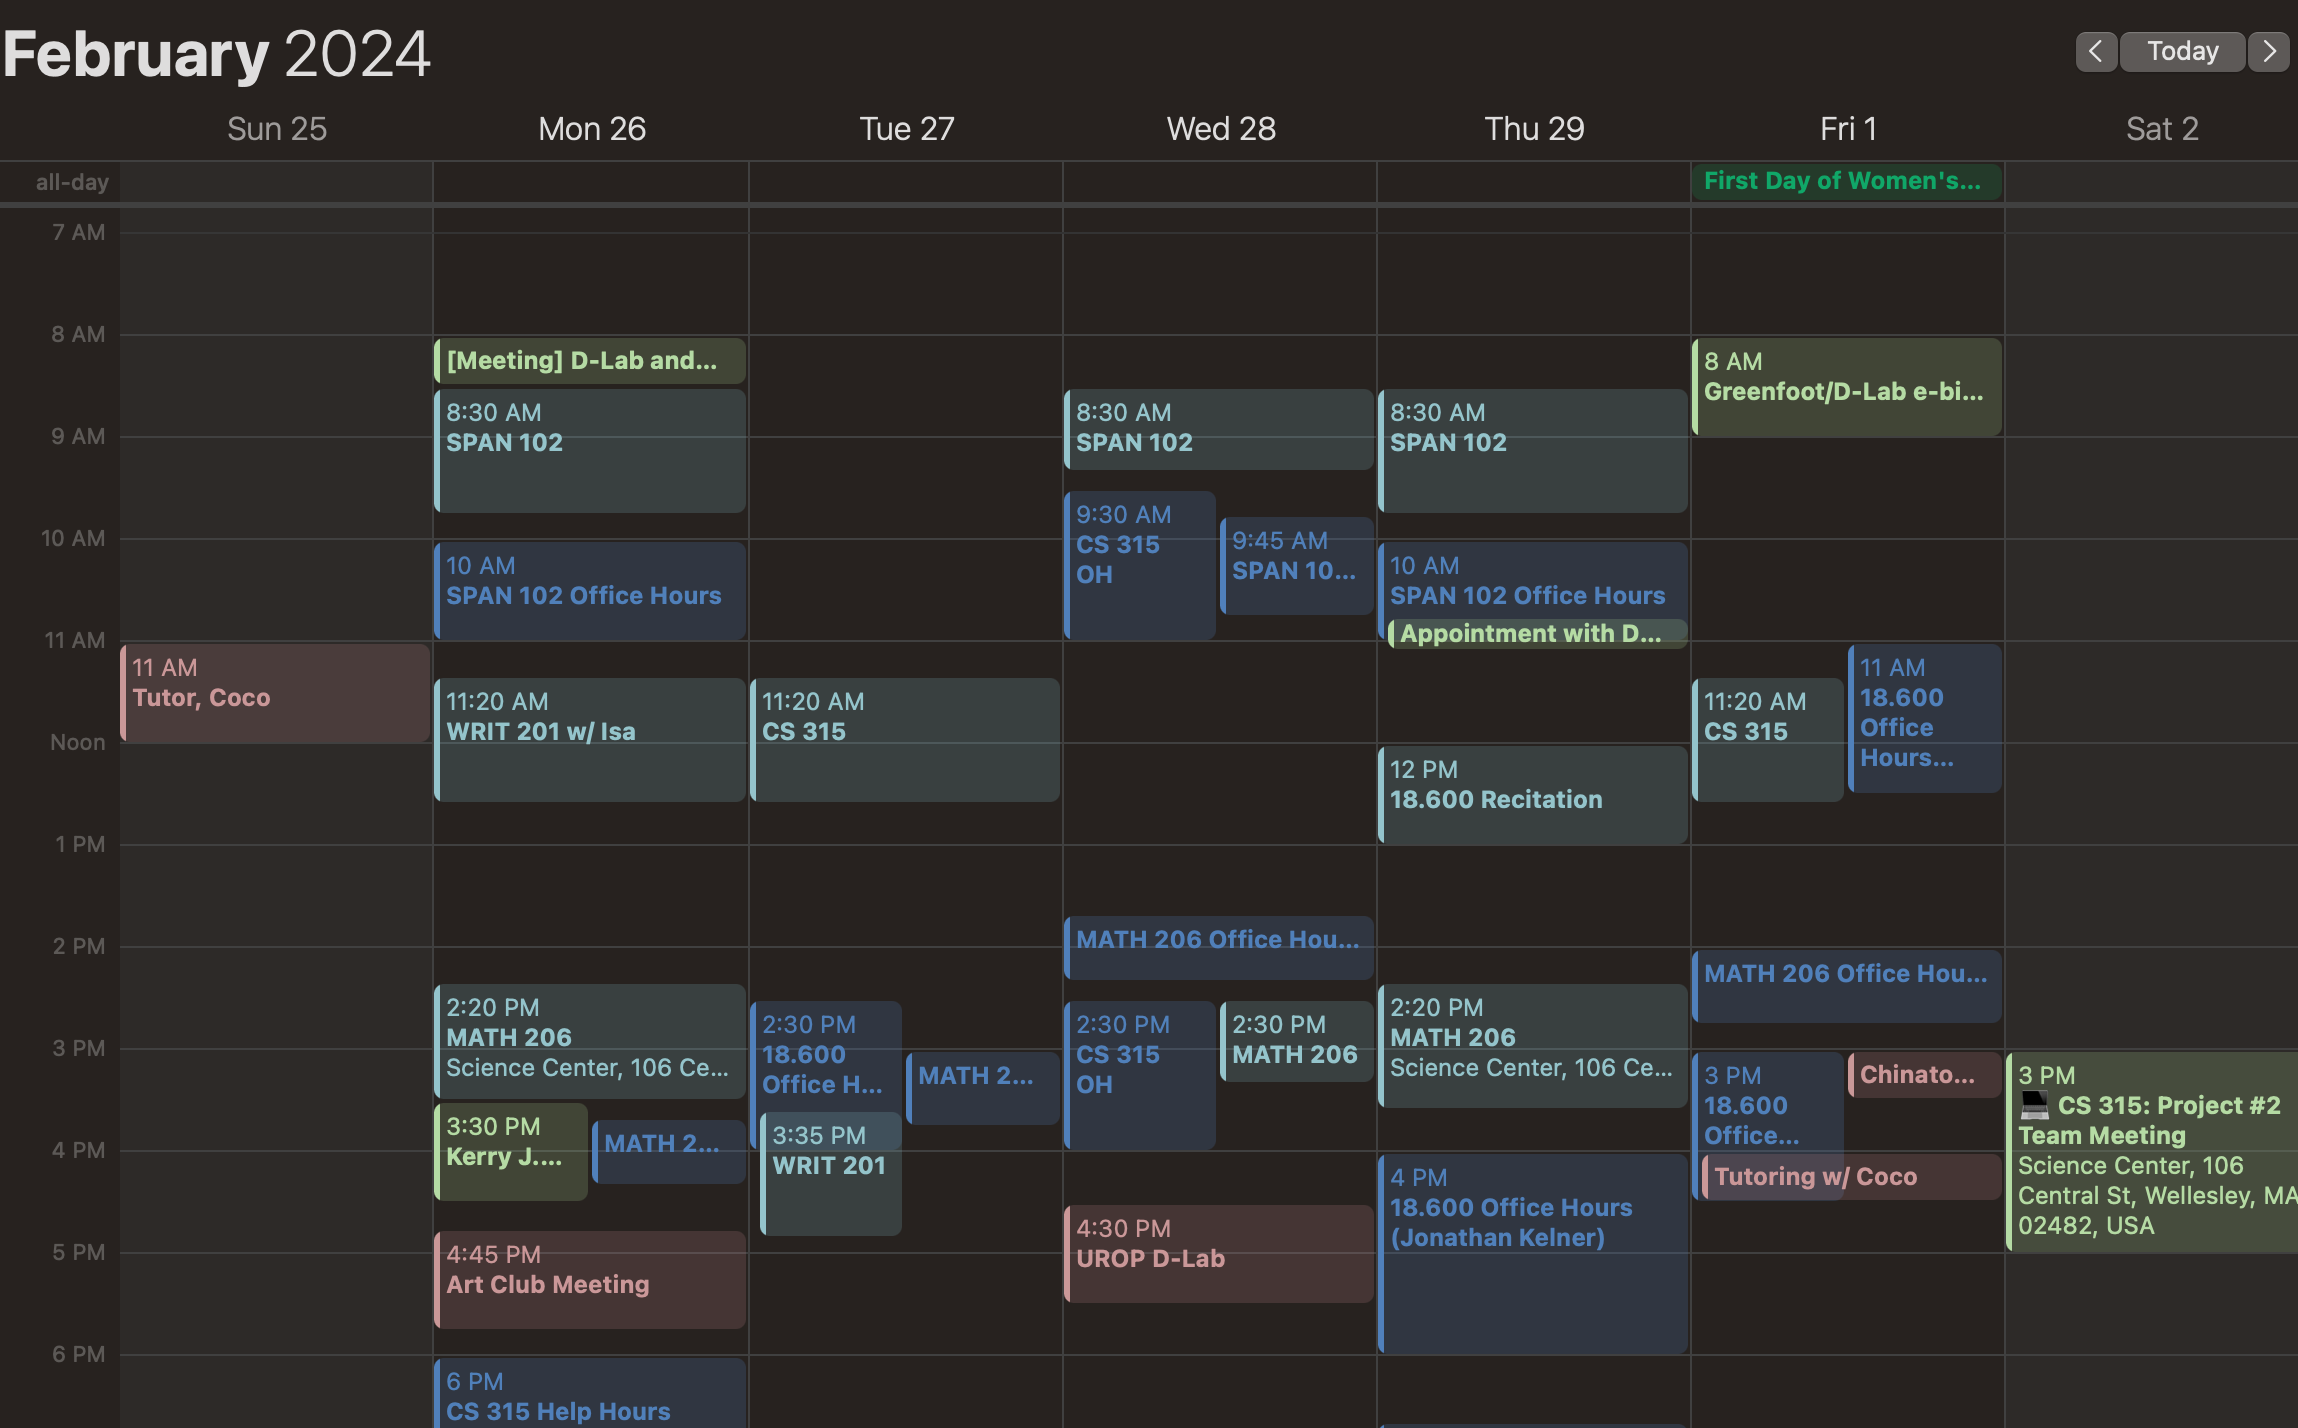
For example, if you specify the same week I have provided my schedule on the left, you can see how my class times correspond with less time on these apps. If you specify the dates: 2/01/2024 - 3/16/2024 (consistent repeated weekly schedule, ending right before spring break), you can also see how on some days there is heavy listening to music at night, which is when I usually had a recurring assignment due the next day.
Notes on the heatmap:
*It seems like Spotify did not give me any listening data for June/July summer months so there can be no comparisons made there.
*At the beginning of this school year, I was trying to like less posts (unless I truly cared or they were my friends) so there is much less data for this at the beginning of this dataset.