
|
|
Assignment 2
|
|
Due: Thursday, February 20 by 5:00pm
You can turn in your assignment up until 5:00pm on 2/20/20. You should
hand in both a hardcopy and electronic copy of your solutions. Your hardcopy
submission should include
printouts of four code files: redsox.m, colonTest.m,
smartPhones.m and analyzeData.m. To save paper, you can
cut and paste all of your code files into one script, but your electronic submission should contain
the separate files. Your electronic submission is described in the
section How to turn in this assignment. If you need an extension on
this assignment, please see the Late Assignment Policy
on the Course Information Page.
You will begin working on the programming exercises for this assignment in lab, working with a new partner. For this assignment, we ask that you again complete both the programming exercises and problems with the same partner. (Starting with Assignment 3, there will be more flexibility in choosing partners for your assignment work.)
Reading
The following material from the fifth or sixth edition of the text is especially useful to review for this assignment: pages 42-43, 111-113, 157-158, and 175-186. You should also review notes and examples from Lectures #4 and #5 and Lab #3.
Getting Started: Download assign2 folders
Use Cyberduck to download the assign2_exercises folder from the download
folder in your individual account on the CS file server. This folder contains two code files for the
exercises in this assignment, redsox.m and colonTest.m.
In MATLAB, set the Current Directory to the assign2_exercises folder
on your Desktop.
When starting the problems on this assignment, download the assign2_problems folder onto your Desktop. This folder contains two code files,
smartPhones.m and analyzeData.m, and a data file named
depthData.mat.
Exercise 1: The Red Sox roster |
|
In this exercise, you'll work with the following subset of data from the Boston Red Sox baseball team roster from the 2018 (World Series winning!) season:
| Player Name | Player Number | Weight | At Bats | Home Runs | Batting Average | 2018 Salary | Runs Batted In | Runs | Stolen Bases |
|---|---|---|---|---|---|---|---|---|---|
| Mookie Betts | 50 | 180 | 520 | 32 | .346 | 10,500,000 | 80 | 129 | 30 |
| J.D. Martinez | 28 | 220 | 569 | 43 | .330 | 23,750,000 | 130 | 111 | 6 |
| Andrew Benintendi | 16 | 170 | 579 | 16 | .290 | 620,500 | 87 | 103 | 21 |
| Xander Bogaerts | 2 | 210 | 513 | 23 | .288 | 7,050,000 | 103 | 72 | 8 |
| Brock Holt | 12 | 180 | 321 | 7 | .277 | 2,225,000 | 46 | 41 | 7 |
| Eduardo Nunez | 36 | 195 | 480 | 10 | .265 | 4,000,000 | 44 | 56 | 7 |
| Mitch Moreland | 18 | 230 | 404 | 15 | .245 | 6,500,000 | 68 | 57 | 2 |
| Rafael Devers | 11 | 237 | 450 | 21 | .240 | 564,500 | 66 | 59 | 5 |
| Jackie Bradley Jr. | 19 | 200 | 474 | 13 | .234 | 6,100,000 | 59 | 76 | 17 |
| Sandy Leon | 3 | 225 | 265 | 5 | .177 | 1,950,000 | 22 | 30 | 1 |
Generating some Red Sox statistics:
The file redsox.m in the assign2_exercises folder creates nine separate
vectors, one for each numerical statistic.
Look closely at the code in redsox.m and note that the names are stored in a
cell array called names.
Think of a cell array as a special kind of vector that allows us to
store strings. Note that names is created using curly braces { }
rather than the square brackets [ ] that we use for numerical vectors. Although a cell array is created using curly braces, you do not need to use curly braces to access its contents. For example, here is a clip of MATLAB code accessing the contents of names:
>> powerHitter = names(homeRuns > 20)
powerHitter =
'Betts' 'Martinez' 'Bogaerts' 'Devers'
Note that you can place a semi-colon at the end of the initial assignment statements in
redsox.m to suppress the printout of the statistics.
In the exercise below, you may use MATLAB's built-in
mean, sum, length, and any functions.
Write MATLAB code to do the following:
- Create a variable totalStolen with the total number of stolen bases in 2018.
- Create a variable avgWt with the average weight of a Red Sox player.
- Create a variable bestBatters with the name(s) of player(s) whose batting average is greater than or equal to .300.
- Create a variable expensiveHomer that is true if any player costs more than $500,000 per homerun.
- Create a variable bigHitter that is true if any players hit more than 10 homeruns with batting averages less than .290.
- Create a vector highRBI with the name(s) of player(s) whose Runs Batted In is greater than or equal to Runs.
- Create a variable bigBatter that contains the number(s) of the player(s) with more than 550 at bats or more than 20 stolen bases.
- Create a variable weightInGold that contains the number of players who were paid more than $25,000 per pound of body weight in the 2018 season.
Add comments to your code so that it is clear and easy to read. Also add comments at the top of each file
with the names of you and your partner, and the date. Save your final version of redsox.m in your
assign2_exercises folder to upload to the CS server.
Exercise 2: Indexing with colon notation
In lecture you learned how to use colon notation to specify a sequence of regularly spaced numbers. You also learned how to use indexing to read and store values in specific locations of a vector. This exercise combines these two concepts. Colon notation can be used to specify an evenly spaced sequence of vector indices or contents, as shown in the following examples:
>> nums = 1:8 nums = 1 2 3 4 5 6 7 8 >> nums(1:2:5) = 10 nums = 10 2 10 4 10 6 7 8 >> nums(2:3:8) = [13 9 16] nums = 10 13 10 4 9 6 7 16 >> nums2 = nums([1:3 6:8]) nums2 = 10 13 10 6 7 16 >> nums([1:3 6:8]) = 12:-2:2 nums = 12 10 8 4 9 6 4 2
The following program, colonTest.m is contained in your assign2_exercises
folder. Follow the instructions in the comments to rewrite the existing code statements and add five
additional statements that use colon notation:
% colonTest.m % program that provides practice with colon notation and indexing % rewrite each of the next 4 statements using colon notation nums1 = [10 9 8 7 6 5 4 3 2 1] nums2 = nums1([2 4 6 8 10 7 4 1]) nums1([3 4 5 6]) = [9 6 3 0] nums3 = [1 2 3 1 2 3 1 2 3] % replace the next 3 statements with a single assignment statement % that uses colon notation nums2(6) = 10 nums2(7) = 20 nums2(8) = 30 % for each of the following examples, use "end" in the colon % notation, for example: nums8 = nums1(3:end) % write a statement that assigns nums4 to a vector that contains % the odd-indexed elements of nums1 % write a statement that assigns nums5 to a vector of the % elements contained in the top half (higher indices) of nums2 % write a statement that assigns nums6 to a vector that contains % every 3rd element of nums1, starting with index 2 % write a statement that places the value 0 in all of the % evenly indexed locations of nums2 % write a statement that places the numbers 8 12 16 20 in the % successive odd-indexed elements of nums2
If you write each code statement with no semi-colon at the end, so that the value generated is printed out during execution of the code, then your program should generate the following printout:
>> colonTest nums1 = 10 9 8 7 6 5 4 3 2 1 nums2 = 9 7 5 3 1 4 7 10 nums1 = 10 9 9 6 3 0 4 3 2 1 nums3 = 1 2 3 1 2 3 1 2 3 nums2 = 9 7 5 3 1 10 20 30 nums4 = 10 9 3 4 2 nums5 = 1 10 20 30 nums6 = 9 3 3 nums2 = 9 0 5 0 1 0 20 0 nums2 = 8 0 12 0 16 0 20 0
Place comments at the top of your file with the names of you and your partner, and the
date. Your final submission should include a copy of your
final colonTest.m code file.
Problem 1: Smartphones |

|
|
With her curiosity piqued by recent smartphone market share data posted by the International Data Corporation, and article on the use of smartphones by healthcare professionals, Wendy Wellesley decided to collect some data on smartphone preferences and uses among Wellesley students. Wendy conducted a survey of smartphone owners with the following questions:
- Which brand of smartphone do you own? (1) Apple iPhone, (2) Google Android, (3) Samsung Galaxy, (4) Other
- If you were to buy a new smartphone in the next 6 months, which brand would you buy? (1) Apple iPhone, (2) Google Android, (3) Samsung Galaxy, (4) Other
- How many minutes per day do you spend doing the following activities on your smartphone: talking? texting? e-mailing? using the internet? listening to music? playing games?
The file smartPhones.m in the assign2_problems folder contains
Wendy's survey data. The file creates two vectors, currentPhones and
newPhones that contain the integers 1-4 indicating the smartphone brand
owned and desired by each of the 150 students who completed the survey. The file also creates
six vectors that each contain the number of minutes per day spent on each smartphone activity,
for each survey participant.
Add code to the smartPhones.m code file to perform the following tasks:
- Display two bar graphs showing the percentage of each brand currently owned (iPhone, Android, Samsung, other) and percentage of each brand that students would buy in the future
- Display a third bar graph showing the average number of minutes per day spent on each of the six smartphone activities
- Print three messages to the user indicating whether the percentage of iPhones, Androids and Samsung Galaxies would increase or decrease
To complete these tasks, consider the following background, tips and guidelines:
The
barfunction can be used to create a bar graph, as shown in the example below that displays the party affiliations of Massachusetts voters. This example prints strings on the X axis using theXTickLabelproperty. The three strings are stored in a cell array, designated by the surrounding curly braces {}, similar to the names of the Red Sox players in Exercise 1. The final statement sets thePositionproperty for the current figure window, which allows the user to specify the location and dimensions of the figure window. The four numbers in the vector [100 100 500 250] specify, in order, the distance from the left side of the figure window to the left side of the computer screen, the distance from the bottom of the figure window to the bottom of the screen, the width of the window, and the height of the window.>> voterParty = [37.1 11.4 51.2]; >> bar(voterParty) >> set(gca, 'XTickLabel', {'Democrats' 'Republicans' 'Independents'}) >> ylabel('% of registered voters') >> title('Party Affiliation of Massachusetts Voters') >> set(gcf, 'Position', [100 100 500 250])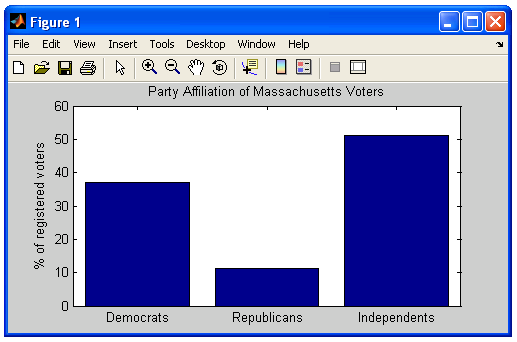
- Use
subplot, described here, to display the three bar graphs in one figure window in a3 x 1configuration. - Create two vectors to store (1) the percentage of each phone brand currently in use
and (2) the percentage of each phone brand that students will buy in the future.
The
zerosfunction can be used to create a vector to store the percentages of iPhones, Androids, Galaxies and other smartphones, and the percentages of each brand can then be calculated and stored in each location of the vector. Your program should calculate these percentages and use them to determine whether the percentage of each phone type will increase or decrease. -
For each of the three main phone brands, print a message something like this:
iPhones would decrease from 46% to 34%The numbers should be obtained from your computed data, and not entered as literal numbers in the string to be printed. Remember that numbers need to be converted to strings when using
disp:>> slugs = 32.15; >> disp(['there are ' num2str(slugs) ' slugs in a pound']); there are 32.15 slugs in a pound
Your final submission should include a copy of your final smartPhones.m
code file. Be sure to add comments at the top of the file with the name(s) of the authors(s),
and any collaborators other than a partner.
Problem 2: Cleaning up the data
Unreliable measurement instruments or unpredictable environments can sometimes yield data that is clearly erroneous. To obtain a reliable assessment of simple properties like the mean value of the data, it may be desirable to remove data samples that are clearly outside the expected range. Such samples are sometimes referred to as outliers. An advantage to analyzing data in MATLAB, with its general programming language, is that we can easily write a program to preprocess the data in a customized way. In this problem, you will complete a program that removes outlying data samples, using the mean and standard deviation of the data.
Imagine that you collected sonar data on the depth of the ocean floor over a large
region that is essentially flat. Due to instrument problems and the occasional large marine
animal, some measurements are clearly invalid. For simplicity, assume that all of the
erroneous measurements are underestimates of the true depth of the ocean floor.
The file analyzeData.m in your assign2_problems folder uses the
load command to load 1000 depth measurements from a file named depthData.mat
into a vector named depthData, and creates a plot of this initial data:
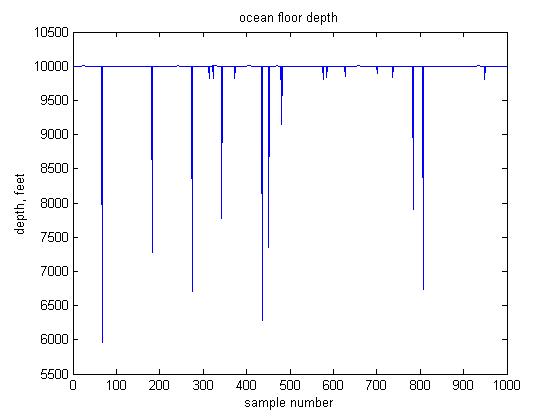
Most of the data is at a depth of around 10,000 feet. The erroneous data samples appear as downward spikes in the data, at depths that are significantly less than 10,000 feet. One principled way to go about removing outlying data is to remove samples whose value is far from the mean value, using the standard deviation to determine the range of values to remove. The standard deviation captures how spread out the data values are, and is given by the following formula:
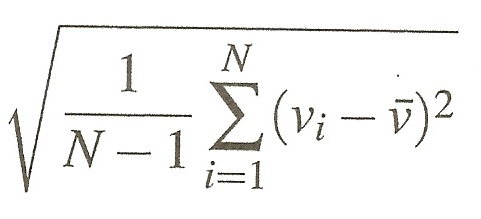
N is the number of samples in the data, vi is the ith data sample, and is the mean value of the data. If the distribution of the data follows a bell-shaped curve (which is not really the case here), almost all of the data should lie within three standard deviations of the mean value.
For the ocean floor depth data, we could just remove all samples that are more than three standard deviations away from the mean depth value. A problem with this strategy is that an initial calculation of the mean and standard deviation of all of the data will be biased by the presence of the outlying data samples. Thus, we will instead use a more conservative approach that removes data in two stages, as described in the following steps, which also print, display and save the data:
- calculate and print the mean and standard deviation of the original data
- modify the data so that samples whose value is more than 4 standard deviations away from the mean value are removed
- calculate and print the mean and standard deviation of the modified data, and plot the modified data
- ask the user if she would like to remove more outliers from the data. If so,
- 4a. modify the data again so that samples whose value is more than 3 standard deviations away from the mean are removed, using the newly calculated mean and standard deviation from step 3
- 4b. calculate and print the mean and standard deviation of the newly modified data, and plot this new data
- save the final modified data and its mean and standard deviation in a file named
newData.mat
Expand the analyzeData.m code file to perform the above steps.
When completing this program, keep in mind the following background, tips and guidelines:
- The built-in
meanfunction can be used to calculate the mean value of the data, but you must compute the standard deviation using the above formula. It is OK to use the built-instdfunction to check your calculation - you should obtain similar results. Keep in mind that the number of samples in the data changes after each modification. - Logical vectors can be used to represent the locations of values in a vector that satisfy a certain logical condition. Steps 2 and 4a describe which data values to remove - how can you rephrase these steps to describe which data values to preserve? This will facilitate your thinking about how to construct a logical vector that has a 1 in locations of data to preserve.
- Create two variables to store the mean and standard deviation of the original
data stored in the
depthDatavector, and re-use these two variable names to store the new mean and standard deviation in steps 3 and 4b. When modifying the data in steps 2 and 4a, re-use the same variable name,depthData. - Calculating the standard deviation and the modified data each involve multiple conceptual steps. Try to incorporate all of these steps into a single assignment statement for each of these two variables. Be careful about the placement of parentheses in these statements!
- In general the values of variables can be printed by omitting the semi-colon at the end of
assignment statements or by using
disp. However, using disp can produce more beautiful and informative output. - When asking the user whether more outliers should be removed, assume that the user
replies with a string, such as
yesorno. Two strings can be compared with thestrcmpfunction that returns true (logical value 1) if the two strings are equal:name = input('Enter your name: ', 's'); if strcmp(name, 'Sohie') disp('I know you! You''re our Lab Instructor!') else disp('I don''t know you') end - Click here for information about using
.matfiles to store and retrieve variables usingsaveandload. - Multiple plots can be displayed within a single figure window using the
subplotfunction, described here. TheanalyzeData.mcode file contains a call tosubplotthat specifies that the figure window should have one row of three plotting areas, and that the first plot should appear in the leftmost area. Usesubplotto place the plot of the intermediate data in the center plotting area and the final data (if further analysis is requested by the user) in the rightmost area. You can expand the window in the horizontal direction by dragging the borders of the window horizontally. Note that the range of values plotted on the axes will differ for the three plots. - Place comments at the beginning of the code file with your name(s) and date, and place a few comments throughout your program briefly describing what is accomplished by small groups of code statements.
- At the end of your program, add comments that record the values of the mean and standard deviation after steps 1, 3, and 4b, and answer the following question: How did the mean and standard deviation change between the initial, intermediate and final data, and why did these quantities change in this way?
Your final submission should include a copy of your final analyzeData.m code
file. Again, be sure to add comments at the top of the file with the name(s) of the authors(s),
and any collaborators other than a partner.
How to turn in this assignment
Step 1. Complete
this online form.
The form asks you to estimate your time spent on the problems. We use this information to help us design assignments for future
versions of CS112. Completing the form is a requirement of submitting the assignment.
Step 2. Upload your final programs to the CS server.
When you have completed all of the work for this assignment, your assign2_exercises
folder should contain two code files named redsox.m and
colonTest.m. Your assign2_problems folder should contain two code files
named smartPhones.m and analyzeData.m and the data file named
depthData.mat. Use Cyberduck to connect to your
personal account on the server and navigate to your cs112/drop/assign2 folder.
Drag your assign2_exercises and assign2_problems folders to this drop
folder. More details about this process can be found on the webpage on
Managing Assignment Work.
Step 3. Hardcopy submission.
Your hardcopy submission should include printouts of four code files:
redsox.m, colonTest.m,
smartPhones.m
and analyzeData.m.
To save paper, you can cut and
paste your four code files into one script, and you only need to submit one hardcopy for you
and your partner. If you cannot submit your hardcopy in class on the due date, please slide
it under Ellen's office door.