
Lab 3. Part 3: Multiple plots together
subplot (an example)
In theassign2_exercises program folder, open the file called
lab3plot.m. This file produces four separate plots,
each in its own Figure window. The plots use MATLAB's default colors and line styles.
Your goal is to rewrite the file so
that it produces one Figure window that contains all four plots,
as shown below. 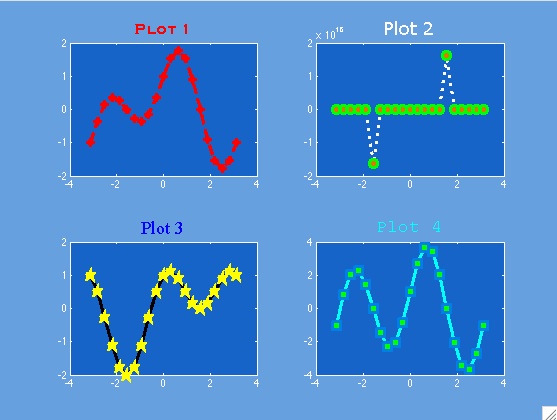
Notes:
- First, create one Figure with the (plain-looking) subplots
(check out MATLAB's help on subplot)
subplot(2,2,1) subplot(2,2,2) subplot(2,2,3) subplot(2,2,4) - Experiment with save and load
Try this:
- >> lab3plot
- Peek at your workspace to see the variables you created (or type
whos) - >> save data x y1 y2 y3 y4 (this saves those variables in a file data.mat)
- Edit
lab3plotso that the assignment statements are commented out, and replace them with a single load statement at the start of the file (load data ) - >> clear all (peek in your workspace)
- Run your new script that uses the saved variables
- Remember this technique if working with large data sets (faster to load than to re-assign)
- Here's a helpful reference page for MAT files and subplot.
- Embellish with custom colors/fonts/etc. The plots above are just samples; you can make yours look as you choose.