
Lab 3. Part 2: Colors in MATLAB
Predefined MATLAB colors
These 8 colors are defined in MATLAB: yellow, magenta, cyan, red, green, blue, white, and black.What if you want a different color? You can create your own!
Specifying Colors in MATLAB
Colors can be specified in three different ways in MATLAB:- short name (e.g. 'r' )
- long name (e.g. 'red')
- RGB triple (e.g. [1 0 0])
| RGB value | MATLAB value | Short name | Long name |
|---|---|---|---|
| [255 255 0] | [1 1 0] | y | yellow |
| [255 0 255] | [1 0 1] | m | magenta |
| [0 255 255] | [0 1 1] | c | cyan |
| [255 0 0] | [1 0 0] | r | red |
| [0 255 0] | [0 1 0] | g | green |
| [0 0 255] | [0 0 1] | b | blue |
| [255 255 255] | [1 1 1] | w | white |
| [0 0 0] | [0 0 0] | k | black |
How to make up your own colors
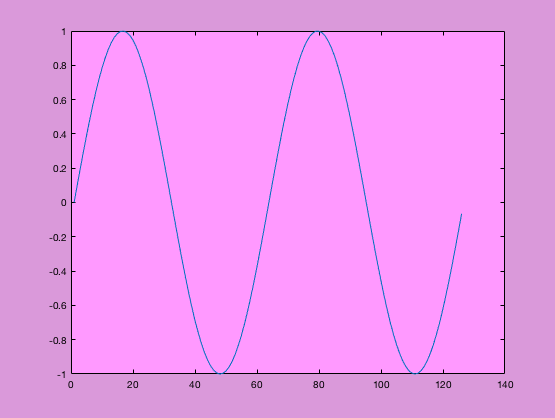
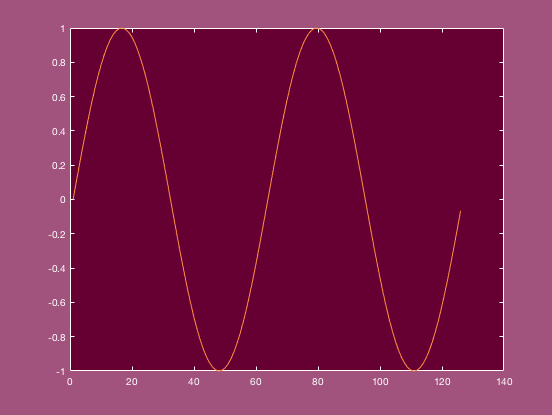
A subtle pink? A deep burgundy? A bright green? You can specify the RGB values and create any color you like. Below is a table of some sample colors. Note that the MATLAB command whitebg changes the background color for the figure and adjusts the other colors for suitable contrast.
whitebg([255/255 153/255 255/255]) |
whitebg([102/255 0/255 51/255]) |
 |
 |
whitebg([?? ?? ??]) |
whitebg([?? ?? ??]) |
 |
 |
These color combinations are available here (and many other places, just Google "RGB color picker").
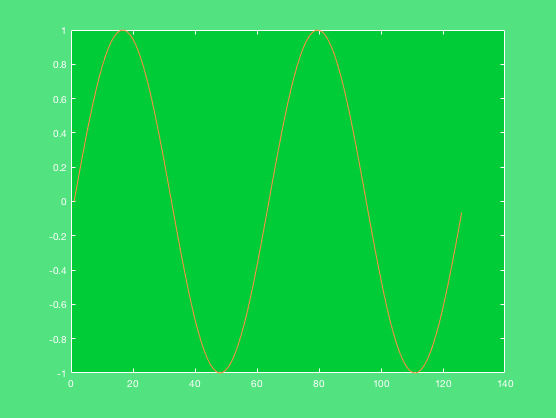
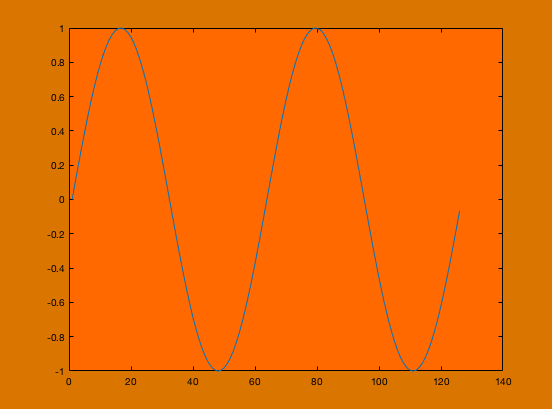
To Do:
The plots above are created usingx = 0:0.1:4*pi and then plotting
plot(sin(x)). See if you and your partner
can figure out how to create the plot with the green background, and then the orange background, as shown above.
Note:
- RGB color has a range [0 255] for each of the 3 colors (red/green/blue)
- each color is divided by 255 to keep it within the [0 1] range that MATLAB requires
- in the plots above, the color is the background color of the axes — MATLAB automatically adjusts the other colors in the plot for suitable contrast
- How to just change the color of the line?
x = -pi:0.01:pi;

            plot(sin(x),'Color',[200/255 200/255 10/255]);
produces this olive greenish line: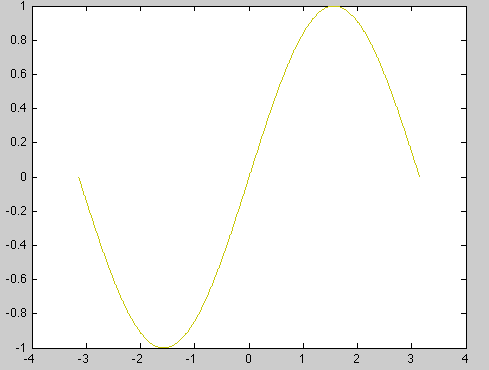
Where to use color in MATLAB?
- line/marker/font colors
- background color of plot
- background color of axis (whitebg changes background color for all axes in the figure, and any new following figures.)